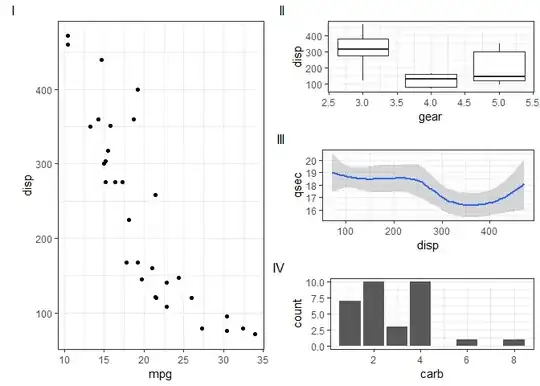
I have been using the plot_grid command from cowplot to arrange my plots. I use the labeling feature, and my plots all look the same in that regard. However, when I 'hv' align some plots that have very different y-axis limits, such as the one below, it appears the height of the plot with shortest range of y is used.
If I just 'v' align the plot it looks better in some respects, but it is hard to resize the plot and have the labels looking good. I'd prefer the plot height not consider the x-axis labels, etc, like above.
Using gtables, I can get the desired width/height (below), but these leaves me without the consistent labels across all the figures in a document. Can I use the 'hv' alignment with cowplot and specify which plot height to use?
library(ggplot2)
library(dplyr)
library(scales)
library(grid)
library(cowplot)

data(iris)

iris <- iris %>% mutate(Petal.Width2 = ifelse(Species == "setosa", Petal.Width * 75, Petal.Width))

p1 <- ggplot(data=iris, aes(x = factor(Species), y=Sepal.Width)) +
  geom_bar(stat="identity") +
  labs(x = NULL, y = "Plot One") +
  scale_y_continuous(labels = percent) +
  theme(axis.text.x = element_blank(),
        axis.title.y = element_text(vjust=1), plot.margin=unit(c(2,2,0,2),"mm"))

p2 <- ggplot(data=iris, aes(x = factor(Species), y=Petal.Width2)) + geom_bar(stat="identity") +
  labs(x = NULL, y = "Plot Two") +
  scale_y_continuous(labels = percent) +
  theme(axis.text.x = element_blank(),
        axis.title.y = element_text(vjust=1), plot.margin=unit(c(0,2,0,2),"mm"))
p3 <- ggplot(data=iris, aes(x = factor(Species), y=Petal.Length*0+.01)) + geom_bar(stat="identity") +
  labs(x = "SPECIES", y = "The Third plot") +
  scale_y_continuous(labels = percent) +
  theme( axis.title.y = element_text(vjust=1, color="blue"), plot.margin=unit(c(0,2,0,2),"mm"),
         axis.text.x = element_text(angle = 90, hjust=1, vjust=1,face ="italic", size=10))

plot_grid(p1,p2,p3,ncol=1, align="v", labels=c("A", "B", "C"))

# https://stackoverflow.com/a/27408589/1670053
plots <- list(p1, p2, p3)
grobs = lapply(plots, ggplotGrob)
g = do.call(rbind, c(grobs, size="first"))

g$widths = do.call(unit.pmax, lapply(grobs, "[[", "widths"))
grid.newpage()
grid.draw(g)


