9

My Problem is the following:

For my work I need to compare images of scanned photographic plates with a catalogue of a sample of known stars within the general area of the sky the plates cover (I call it the master catalogue). To that end I extract information, like the brightness on the image and the position in the sky, of the objects in the images and save it in tables. I then use python to create a polynomial fit for the calibration of the magnitude of the stars in the image. That works up to a certain accuracy pretty well, but unfortunately not well enough, since there is a small shift between the coordinates the object has in the photographic plates and in the master catalogue.

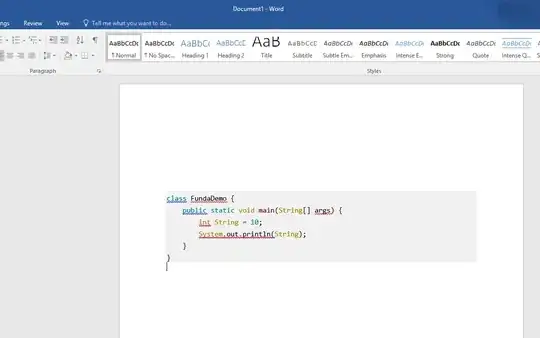
Here the green circles indicate the positions (center of the circle) of objects in the master catalogue. As you can see the actual stars are always situated to the upper left of the objects in the master catalogue.

I have looked a little bit in the comparison of images (i.e. How to detect a shift between images) but I'm a little at a loss now, because I'm not actually comparing images but arrays with the coordinates of the objects. An additional problem here is that (as you can see in the image) there are objects in the master catalogue that are not visible on the plates and not all plates have the same depth (meaning some show more stars than others do).

What I would like to know is a way to find and correct the linear shift between the 2 arrays of different size of coordinates in python. There shouldn't be any rotations, so it is just a shift in x and y directions. The arrays are normal numpy recarrays.

Community
  • 1
  • 1
Christoph Pohl
  • 325
  • 5
  • 19

3 Answers3

1

There are several possible solutions Note - these are high level pointers, you'll need some work to convert it to working code

The original solution (cross correlation) can be adapted to the current data structure, and should work

A believe that RANSAC will be better in your case basically it means: create a model based on a small number of data points (the minimal number that are required to define a relevant model), and verify it's correctness using the full data set.

specifically, if you have only translation to consider (and not scale):

  1. select one of your points
  2. match it to a random point in the catalog [you may do "educated guesses", if you have some prior about what translation is more likely]
  3. this matching gives you the translation
  4. verify this translation matches the rest of your points
  5. repeat until you find a good match
Ophir Yoktan
  • 8,149
  • 7
  • 58
  • 106
1

I'm assuming here the objects aren't necessarily in the same order in both the photo plate and master catalogue.

Consider the set of position vectors, A, of the objects in the photo plate, and the set of position vectors, B, of the objects in the master catalogue. You're looking for a vector, v, such that for each a in A, a + v is approximately some element in b.

The most obvious algorithm to me would be to say for each a, for each b, let v = b - a. Now, for each element in A, check that there is a corresponding element in B that is sufficiently close (within some distance e that you choose) to that element + v. Once you find the v that meets this condition, v is your shift.

1

I would change @OphirYoktan's suggestion slightly. You have these circles. I assume you know the radius, and you have that radius value for a reason.

Instead of randomly choosing points, filter the master catalog for x,y within radius of your sample. Then compute however many vectors you need to compute for all possible master catalog entries within range of your sample. Do the same thing repeatedly, then collect a histogram of the vectors. Presumably a small number will occur repeatedly, those are the likely true translations. (Ideally, "small number" == 1.)

aghast
  • 14,785
  • 3
  • 24
  • 56
  • The radius of the circle is the search radius for an algorithm that looks through my master catalogue to find possible matches between catalogue and image. So I extracted now all possible matches and calculated the differences between them as you suggested and it seems to work. The histograms are not perfect but after smoothing them out, I get a maximum which I can use to get the translation. Thanks – Christoph Pohl Mar 13 '16 at 00:29