Consider this example:
labs <- c("AT~frac(T,C)~G","GGAA","TTAA","AAAA")
plot(c(1:4), c(1:4), axes=F, xlab="",ylab="", par(mar=c(8,3,2,1)))
axis(1, at=c(1:4), labels=labs, las=2)
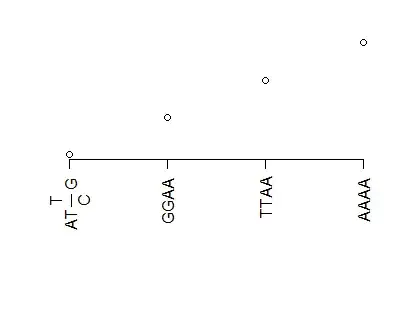
that generates this:
My intention is to have something like this:
that I hardcoded as:
plot(c(1:4), c(1:4), type="n", axes=F, xlab="",ylab="")
axis(1, at=c(1:4), labels=c(expression(AT~frac(T,C)~G), expression(GGAA), expression(TTAA), expression(AAAA)), las=2)
The closest answer I got was this.
Getting expression() to work as I desired is really very confusing for me. I intend to have these x-axis tick mark labels dynamically generated from available data using a vector of "expression strings".


