How can I make a triplot for CCA using scikit-bio (python)?
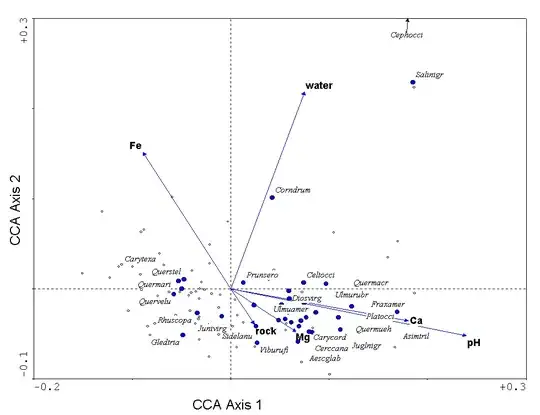
I'm trying to make a triplot from canonical correspondence analysis; for example: 
This should have points for both samples and species and should have vectors for environmental variables. The default visualization provided by skbio is a 3d plot. I am able to make a 2d plot of the samples and species from the data, but I can't figure out how to get the information for the vectors for the environment variables.
import numpy as np
import pandas as pd
import matplotlib.pyplot as plt
import skbio

# I'll use the sample data from the skbio website
# http://scikit-bio.org/docs/latest/generated/skbio.stats.ordination.html#module-skbio.stats.ordination

X = np.array([[1.0, 0.0, 1.0, 0.0],
               [2.0, 0.0, 1.0, 0.0],
               [3.0, 0.0, 1.0, 0.0],
               [4.0, 0.0, 0.0, 1.0],
               [5.0, 1.0, 0.0, 0.0],
               [6.0, 0.0, 0.0, 1.0],
               [7.0, 1.0, 0.0, 0.0],
               [8.0, 0.0, 0.0, 1.0],
               [9.0, 1.0, 0.0, 0.0],
               [10.0, 0.0, 0.0, 1.0]])
transects = ['depth', 'substrate_coral', 'substrate_sand',
              'substrate_other']
sites = ['site1', 'site2', 'site3', 'site4', 'site5', 'site6', 'site7',
         'site8', 'site9', 'site10']
X = pd.DataFrame(X, sites, transects)
del X['substrate_other']

species = ['specie1', 'specie2', 'specie3', 'specie4', 'specie5',
           'specie6', 'specie7', 'specie8', 'specie9']
Y = np.array([[1, 0, 0, 0, 0, 0, 2, 4, 4],
              [0, 0, 0, 0, 0, 0, 5, 6, 1],
              [0, 1, 0, 0, 0, 0, 0, 2, 3],
              [11, 4, 0, 0, 8, 1, 6, 2, 0],
              [11, 5, 17, 7, 0, 0, 6, 6, 2],
              [9, 6, 0, 0, 6, 2, 10, 1, 4],
              [9, 7, 13, 10, 0, 0, 4, 5, 4],
              [7, 8, 0, 0, 4, 3, 6, 6, 4],
              [7, 9, 10, 13, 0, 0, 6, 2, 0],
              [5, 10, 0, 0, 2, 4, 0, 1, 3]])
Y = pd.DataFrame(Y, sites, species)

# End sample data

# Perform CCA on the sample data
cca_test = skbio.stats.ordination.cca(y=Y, x=X)

# 2d plot of samples and species
plt.scatter(x=cca_test.samples['CCA1'], y=cca_test.samples['CCA2'], color='blue')
plt.scatter(x=cca_test.features['CCA1'], y=cca_test.features['CCA2'], color='red')

# Where are the environment variables?