0

I'm generating several plots in matlab using plot and surf/mesh. When I try to save them as SVG or PDF (from the figure window save menu) I get nice vector graphics for the plot but a non-vector graphics embedded in the SVG or PDF for the surf or mesh.

Any idea about how to fix this problem?

Andrestand
  • 156
  • 1
  • 1
  • 16
  • Have you tried other export methods? I use `export_fig`. The `pdf`s are vector images, but `contour` plots are segmented and in `surf` plots the triangulation is visible like there is tiny gap between the triangles. May be this is caused how each export method deals with (possible) colour shades. The matlab's default tool probably rasterizes the figure and then save it as given format. `export_fig` probably vectorizes the figure (segments all objects to parts with same colour) and saves it. – Crowley Mar 30 '16 at 13:43
  • I'll try. With my method even the axes are rasterized when dealing with a `surf` or `mesh` figure. – Andrestand Mar 30 '16 at 13:50
  • I don't know what you do mean with `export_fig`, could you please use it in a short example? I've already tried using `saveas(gcf,'picture','pdf')` and `saveas(gcf,'picture','svg')` with similar non-vector results... – Andrestand Mar 30 '16 at 14:24
  • `print('picture','-dpdf')` and ´print('picture','-dsvg')` give the same problem. – Andrestand Mar 30 '16 at 14:45

2 Answers2

2

The export_fig is macro fro exporting figures to various file formats. With GhostScript installed it can export directly in pdf format. One can download it form File Exchange.

Using

export_fig('foo','-pdf','-nocrop')

it produces this result (Screenshot of Adobe Acrobat):

Zoomed 100% Zoomed In

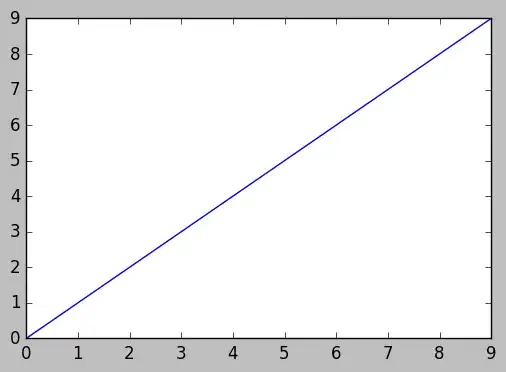
If you look closer, you can see the edges of triangulation (lines of "missing pixels") in result of surf plot and segmentation of contour plot in second picture.

You can see that rasterisation occurs in last step (PrintScreen in this case) so the resulting pdf is composed of segments in vector format thus labels, axes and results of line plot will be in vector

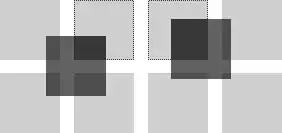
If this pdf is exported to bitmap, say png, those "missing" pixels vanish and do does the "see-through" effect from first image. See (Adobe Acrobat 9 Pro; Interlace: Adam7, Filter: adaptive)

resolution 300 px/in (image with resolution 2400 px/in is too large) Zomm100%

resolution 2400 px/in Zoom1 Zoom2

Plot was generated by code from this answer.

Community
  • 1
  • 1
Crowley
  • 2,279
  • 6
  • 22
  • 36
  • Nice! Now I wonder if it would be possible an intermediate approach, where the `surf` or `mesh` is rasterized but the axes, labels, legend... are vector. Anyway, some time ago I managed to do what I was looking for, but using GNUplot, so it would be great to achieve it also in Matlab... (http://gredos.usal.es/jspui/bitstream/10366/123970/3/TG_GarciaAndres.pdf, p.28 for example) – Andrestand Mar 30 '16 at 16:04
  • Maybe the "rasterized" export of `surf` by `saveas`, "vectorized" export of rest of figure by `export_fig` and merging them together somewhere else is the way to achieve that. I haven't played with renders yet so there could be something to play with. Maybe... – Crowley Mar 30 '16 at 16:09
  • :( I want to believe Matlab has some way to produce nice 2D vector graphics color maps. Thank you! – Andrestand Mar 30 '16 at 16:11
  • Although my images look a bit ugly (segmented contours, visible edges of triangulation) note that the second image is 42 times magnified! When I raserize the image in Acrobat (File->Export->Image) it looks very nice :) – Crowley Mar 30 '16 at 16:22
  • @Andrestand See my edit. You can see that the result depends on how the data in vector format are processed to bitmap (matlab's `saveas`, Adobe's *File-Export-Image* and pdf preview). From your link above I can see that you have same obsession as I do :) – Crowley Mar 30 '16 at 16:47
  • :) I do. I know, but if I'm generating weighty figure files I prefer them to be vector than high resolution raster :( – Andrestand Mar 31 '16 at 08:24
  • Let us [continue this discussion in chat](http://chat.stackoverflow.com/rooms/107852/discussion-between-crowley-and-andrestand). – Crowley Mar 31 '16 at 11:48
0

I don't know the reason, but I've ended figuring out where the problem should be.

I was using mesh, which produced something like (plot and colorbar): enter image description here

Trying with surf; shading interp or pcolor generated huge files, so I avoided them.

The option I was looking for is quite similar to what you get when using imagescinstead of mesh: enter image description here

It's not perfect, you can see some strange thin white diagonals due to the axes or colorbar main boxes: enter image description here but I get enough quality vector files.

Also, if you use mesh and imagesc in several subplots in the same figure, you get also a raster image for the imagesc embedded in the pdf or svg file: enter image description here

Andrestand
  • 156
  • 1
  • 1
  • 16
  • You may hide white diagonals by ungrouping the plot several times in inkScape and moving a bit more together the 2 parts in which the map is divided. More about the problem here: http://es.mathworks.com/matlabcentral/answers/162257-problem-with-patch-graphics-in-2014b-splits-in-two-along-diagonal – Andrestand Apr 05 '16 at 09:32