Is there a htop/top on Linux where I get to sort processes by network usage?
Asked
Active
Viewed 2.8e+01k times
293
-
1ubuntu: https://askubuntu.com/questions/532424/how-to-monitor-bandwidth-usage-per-process – Ciro Santilli OurBigBook.com Oct 29 '17 at 02:04
7 Answers
368
NetHogs is probably what you're looking for:
a small 'net top' tool. Instead of breaking the traffic down per protocol or per subnet, like most tools do, it groups bandwidth by process.
NetHogs does not rely on a special kernel module to be loaded. If there's suddenly a lot of network traffic, you can fire up NetHogs and immediately see which PID is causing this. This makes it easy to identify programs that have gone wild and are suddenly taking up your bandwidth.
Since NetHogs heavily relies on /proc, most features are only available on Linux. NetHogs can be built on Mac OS X and FreeBSD, but it will only show connections, not processes...
Matthias Braun
- 32,039
- 22
- 142
- 171
-
26This is my favorite as it splits bandwith usage up by process. Really useful. – fccoelho Feb 17 '11 at 12:58
-
thank you. I was aware of iptraf ofcourse, its the oldest tool in the shed. but this by process and owner is what I needed as well. Useful answer +1 – Abhishek Dujari Feb 18 '14 at 09:03
-
`nethogs` is nice, but it seems to use _way_ more cpu on my computer than `iftop` – aidan Jul 29 '15 at 06:15
-
Good tool. You can also create snapshots over a certain period of time with options `-t`, `-c` and parse it with grep/sed. – phil294 Aug 26 '19 at 14:15
188
Also iftop:
display bandwidth usage on an interface
iftop does for network usage what top(1) does for CPU usage. It listens to network traffic on a named interface and displays a table of current bandwidth usage by pairs of hosts. Handy for answering the question "why is our ADSL link so slow?"...
-
4Nice interface, but I don't see an option to filter network activity by process? – Chris Apr 24 '16 at 03:42
62
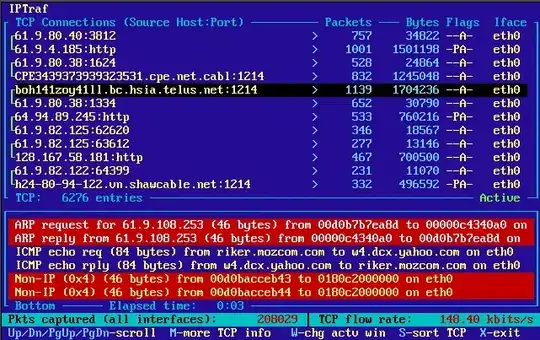
iptraf is my favorite. It has a nice ncurses interface, and options for filtering, etc.
robbyt
- 1,334
- 14
- 16
-
11top shows system activity for each process on the system. the only ways that I have seen iptraf used is to show activity of the system; i'm not aware of any facility to show individual process traffic in iptraf. – rektide Apr 18 '13 at 21:10
-
-
@galva The font is VGA text-mode 8x16, and you can download a modern font version of it at the [Oldschool PC Font Resource](https://int10h.org/oldschool-pc-fonts/). – Malvineous Mar 29 '20 at 01:50
-
> fatal: This program requires a screen size of at least 80 columns by 24 lines Please resize your window — – Huge Aug 20 '23 at 06:09
51
jnettop is another candidate.
edit: it only shows the streams, not the owner processes.
Kartikey Tanna
- 1,423
- 10
- 24
Egil
- 5,600
- 2
- 32
- 33
8
earthmeLon
- 640
- 8
- 20
Oli
- 235,628
- 64
- 220
- 299
-
13Not to detract from Oli's contribution - ntop has multiple dependencies (gdbm, rrdtool, everything rrdtool requires), and while it's a useful tool if you have a long-term need to store and query. If you literally just want 'top, but for network traffic', iftop mentioned by Jim T is a much simpler solution. – synthesizerpatel Jul 05 '11 at 22:03
4
Check bmon. It's cli, simple and has charts.
Not exactly what question asked - it doesn't split by processes, only by network interfaces.
luchaninov
- 6,792
- 6
- 60
- 75