0

I have a faceted plot (about which I had this other question). I would like to control the interval of ylim() to reduce the clutter because it looks like this:

alt text

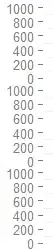
It's too detailed and I would like to display only 0 and 500, that is not even the maximum (the thin horizontal lines are enough). The reasons I want only those 2 values are:

  • reduce the granularity (the values every 200 are crammed vertically)
  • by avoid 1000 there will be more space between 0 and the next value belonging to the facet plot below.

Thanks in advance.

Community
  • 1
  • 1
wishihadabettername
  • 14,231
  • 21
  • 68
  • 85
  • If I see the sequence of your questions, I believe you better take a good look at the help files first. Go through all the material here : http://had.co.nz/ggplot2/ Also the answer on this question is easily found in there. – Joris Meys Sep 10 '10 at 08:15

1 Answers1

1

just add the following to your code. you can tweak it based on what labels you want displayed on the y-axis.

scale_y_continuous(breaks = c(0, 500))
Ramnath
  • 54,439
  • 16
  • 125
  • 152