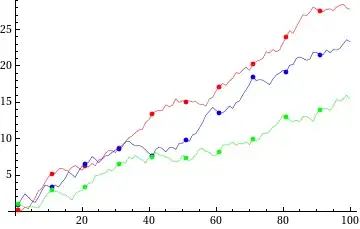
My data frame is this one:
data <- data.frame("GROUP"= c(1,1,1,1,1,1,1,1,2,2,2,2,2,2,2,2,3,3,3,3,3,3,3,3), "C1_PERCENTAGE" = c(0, 10 ,22, 34, 37, 18, 24, 13), "C2_PERCENTAGE"=c(0, 8, 20, 24, 23, 11, 18, 9))
I want to produce a bar plot with the bars stacked horizontally based on GROUPso that there will be three groups of bars horizontally. And vertically, I want to stack the bars based C1_PERCENTAGE and C2_PERCENTAGE.
I want to use ggplot2. I used base graphics but this is for C1_PERCENTAGE only.
barplot(data$C1_PERCENTAGE, col = as.factor(data$GROUP)
This gives plot for C1_PERCENTAGE. I would like C2_PERCENTAGE also alongside these bars.


