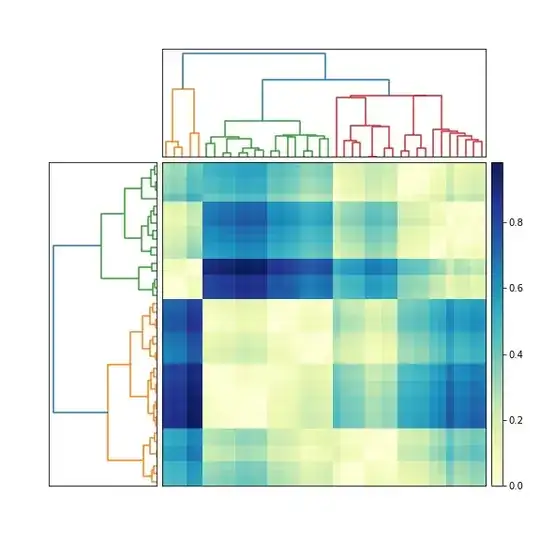
I have an image that I would like to rotate. Namely, exchange the x and y axes. It is of a spectrogram. The basic code is
import matplotlib.pyplot as plt

Sxx, f, t, im = plt.specgram(dataArray, NFFT=2**8, Fs = 100, noverlap = 128)

plt.show()
This is what gets produced:
Does Python have a function that rotates the image 90 degrees as easily as the View function does in Matlab?
UPDATE
I've learned that plt.specgram can take all kwargs that imshow does. I still couldn't find any that would rotate the image, though. Anyone know?
UPDATE 2
I found here and confirmed here that Matlab has an argument option freqloc that can be used to exchange where the axes are drawn, but I can't locate the Python equivalent.

