This is similar but not equal to Using weights in R to consider the inverse of sampling probability.
I have a long data frame and this is a part of the real data:
age gender labour_situation industry_code FACT FACT_2....
35  M      unemployed       15            1510
21  F      inactive         00            651
FACT is a variable that means, for the first row, that a male unemployed individual of 35 years represents 1510 individuals of the population.
I need to obtain some tables to show relevant information like the % of employed and unemployed people, etc. In Stata there are some options like tab labour_situation [w=FACT] that shows the number of employed and unemployed people in the population while tab labour_situation shows the number of employed and unemployed people in the sample.
A partial solution could be to repeat the 1st row of the data frame 1510 times and then the 2nd row of my data frame 651 times? As I've searched one options is to run
longdata <- data[rep(1:nrow(data), data$FACT), ]
employment_table = with(longdata, addmargins(table(labour_situation, useNA = "ifany")))
The other thing I need to do is to run a regression having in mind that there was cluster sampling in the following way: the population was divided in regions. This creates a problem: one individual
interviewed in  represents
  people while an individual interviewed in
  represents
  people but and are not in proportion to the total population of each region, so some regions will be overrepresented and other regions will be underrepresented. In order to take this into account, each observation should be weighted by the inverse of its probability of being sampled.
The last paragraph means that the model 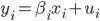 can be estimated with valid equations
 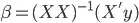 BUT the variance-covariance matrix won't be
 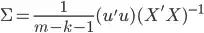 but
but  if I consider the inverse of sampling probability.
In Stata it is possible to run a regression by doing reg y x1 x2 [pweight=n] and that calculates the right variance-covariance matrix considering the inverse of sampling probability. At the time I have to use Stata for some part of my work and R for others. I'd like to use just R.