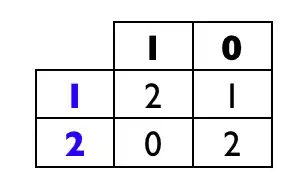
I have the following data.frame:
ef2 <- data.frame(X1=c(50,100,'bb','aa'), X2=c('A','A','B','B'), value=c(1,4,3,6))
I want to create two plots, one for each group in X2.
Here is the code I have and the plot obtained:
ggplot(data=ef2, aes(x=X1, y=value, group=X2)) +
  facet_grid(.~X2, scales="free_x") +
  geom_line(size=1) +
  geom_point(size=3) +
  xlab('') +
  ylab('Y')
The problem is that the x-axis is ordered alphabetically and I don't know how to fix it. I have tried adding scale_x_discrete, but I don't know how to separate groups. You can see the plot I obtained adding this parameter in the following link:
ggplot(data=ef2, aes(x=X1, y=value, group=X2)) +
  facet_grid(.~X2, scales="free_x") +
  geom_line(size=1) +
  geom_point(size=3) +
  xlab('') +
  ylab('Y') +
  scale_x_discrete(limits=ef2$X1)
Edited: I can't change ef2 data.frame. I've tried ordering factors in another data.frame:
ef2 <- data.frame(X1=c(50,100,'bb','aa'), X2=c('A','A','B','B'), value=c(1,4,3,6))
ef2$X1 <- as.character(ef2$X1)
nou <- data.frame(X1=factor(ef2$X1), levels=ef2$X1, X2=ef2$X2, value=ef2$value)
But it doesn't work.


