1

Suppose we have:

  1. A curve described by a two-dimensional dataset that describes approximately a high order polynomial curve.
  2. A line defined by two points.

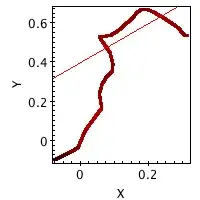
This is a sample image:

Supposing the line and the curve intercept each other, how could I find the intersection point between the line and the dataset?

code_onkel
  • 2,759
  • 1
  • 16
  • 31
Julia Roquette
  • 537
  • 1
  • 6
  • 17
  • Do you mean the intersection of the line and the imaginary one defined by p1 and p2? – martineau Jun 21 '16 at 18:16
  • What does you 2D data set look like? And what exactly do you mean by the intersection? A set of points doesn't necessarily have an intersection with a line. – Chris Mueller Jun 21 '16 at 18:16
  • I don't get it as well. Where is your 2D data set? – code_onkel Jun 21 '16 at 18:17
  • 1
    Also ... [3D Line-Plane Intersection](http://stackoverflow.com/q/5666222/2823755) – wwii Jun 21 '16 at 18:26
  • the 2d dataset looks like a polynomial curve of high degree. p1 and p2 can be any two points that define a straight line. By intersection between the two points I mean: If the line intercepts the curve, close to which point in the curve does it happen? – Julia Roquette Jun 21 '16 at 18:26
  • @wwii Please see Julia's comment. This is not a duplicate (of line-plane-intersection). – code_onkel Jun 21 '16 at 18:30
  • Sorry, I misread that as a 3-d curve: for a 2-d curve, perhaps [How to find the points of intersection of a line and multiple curves in Python?](http://stackoverflow.com/q/29904423/2823755) will help. – wwii Jun 21 '16 at 18:30
  • @wwii, in this case (http://stackoverflow.com/questions/29904423/how-to-find-the-points-of-intersection-of-a-line-and-multiple-curves-in-python) the dataset is close to a polinomial curve of degree 2, so the solution was based on it. In my case the curves are not that simple. – Julia Roquette Jun 21 '16 at 18:35
  • From the SciPy Cookbook [Function Intersections](http://scipy-cookbook.readthedocs.io/items/Intersection.html). – wwii Jun 21 '16 at 18:37
  • The function describing the dataset is unknown. – Julia Roquette Jun 21 '16 at 18:40
  • @JuliaRoquette In order to intersect you need a well-defined function in mathematical terms (either by approximation or interpolation). Maybe you should get some advice on [math.se](http://math.stackexchange.com) on the actual mathematical problem you want to solve (I'll be glad to help). – code_onkel Jun 21 '16 at 18:44
  • Use [scipy.interpolate.interp2d](http://docs.scipy.org/doc/scipy/reference/generated/scipy.interpolate.interp2d.html) to create a function from your data. Or [scipy.interpolate.interp1d](http://docs.scipy.org/doc/scipy/reference/generated/scipy.interpolate.interp1d.html#scipy.interpolate.interp1d) – wwii Jun 21 '16 at 18:45
  • @wwii I know think this is really is a separate question (and interpolate2d is probably the answer), since the curve in the image is actually a proper curve and not a function. – code_onkel Jun 21 '16 at 18:48
  • Here's what the curve look like: – Julia Roquette Jun 21 '16 at 18:49
  • I could interpolate a polynomial to some parts of the dataset. But it doesn't solve the problem, since in principle I don't know which part of the curve the line is intercepting. – Julia Roquette Jun 21 '16 at 18:53
  • The image looks as the points are quite dense and do not scatter. If they are ordered along the curve as well, you could simply intersect each interpolation line of two adjacent curve points with the line and check if the point lies between the two curve points. – code_onkel Jun 21 '16 at 18:56
  • Since we closed the question, you should probably repost. Be sure to include the picture of the example data and explain that the 2-d dataset is not a smooth fuction. This sounds like a Nearest Neighbor problem. – wwii Jun 21 '16 at 18:57
  • @wwii I'm sorry to insist, but why do you close the question as duplicate before it has been clarified and tell the OP to repost when it could be re-opened? After a little bit of editing the question will be fine. – code_onkel Jun 21 '16 at 19:07
  • @code_onkel: I voted to close based on the info in the question. The question seemed straightforward and the the term *curve* implies to me a smooth function - based on that I was pretty sure the problem had been solved before and this question appeared to be a duplicate of a number of questions here on SO. Someone else agreed and it was closed. I don't know if that process can be reversed but reposting a question with a better description of the problem is still an option. – wwii Jun 21 '16 at 22:27
  • I've flagged it for a moderator to look at it. – rrauenza Jun 21 '16 at 22:43
  • @wwii I understand your initial vote. Also, the closing was actually due to the gold badge user (I don't see his name in the iOS app). I simply think it would have been nice to allow Julia more time to elaborate on her question. – code_onkel Jun 21 '16 at 22:46
  • for what it's worth I also don't think this should be closed. The question specifies a two dimensional dataset quite explicitly, as well as which there is a picture showing a line of discrete points which patently isn't a reasonably polynomial. I would have suggested using argsort on the difference between actual y values and the calculated values using the x values and the straight line formula – paddyg Jun 21 '16 at 23:16
  • this kind of thing ## import numpy as np ## A = np.random.random((20, 2)) ## A[:,0] = np.arange(20) ## A[:,1] = A[:,1] * (7.5 + A[:,0]) # some kind of wiggly line ## a = -5.0 # intercept ## b = 1.15 # gradient ## B = np.abs((a + A[:,0] * b) - A[:,1]) # error ## ix = np.argsort(B) ## print(ix, B[ix], A[ix]) ## where ## are placeholders for line endings – paddyg Jun 21 '16 at 23:29

2 Answers2

2

As per my comment above

import numpy as np

A = np.random.random((20, 2))
A[:,0] = np.arange(20)
A[:,1] = A[:,1] * (7.5 + A[:,0]) # some kind of wiggly line
p0 = [-1.0,-6.5] # point 0
p1 = [22.0, 20.0] # point 1

b = (p1[1] - p0[1]) / (p1[0] - p0[0]) # gradient
a = p0[1] - b * p0[0] # intercept
B = (a + A[:,0] * b) - A[:,1] # distance of y value from line
ix = np.where(B[1:] * B[:-1] < 0)[0] # index of points where the next point is on the other side of the line
d_ratio = B[ix] / (B[ix] - B[ix + 1]) # similar triangles work out crossing points
cross_points = np.zeros((len(ix), 2)) # empty array for crossing points
cross_points[:,0] = A[ix,0] + d_ratio * (A[ix+1,0] - A[ix,0]) # x crossings
cross_points[:,1] = A[ix,1] + d_ratio * (A[ix+1,1] - A[ix,1]) # y crossings

print(ix, B, A, cross_points)
paddyg
  • 2,153
  • 20
  • 24
0

Since the curve data appears to be dense and not scattered (as for example the result of a numerically solved differential equation), interpolating or approximating the whole curve dataset is overkill. In the following, I assume that the points of the dataset are ordered along the curve (as if they were the result of sampling a parametric curve).

  1. First, do a coordiante transformation A(x,y) with a translation an a rotation such that the red line matches the x axis.

  2. Intersect the transformed curve with the x axis, i.e. take all points from the curve dataset with a small absolute value of the y-coordinate (and remember their indices in the dataset). Try y < 0.05 for the depicted curve.

  3. Use the indices from the points selected in 2. to detect ranges of adjacent curve points, each range resembling a small bit of the curve.

Sloppy version

  1. For each range, take the average value x_mean of the x-coordinates. The inverse coordinate transformation A_inv(x_mean, 0) will give you an approximation of the intersection point of that range. Depending on your use case and the complexity of potential curves, the approximation may already be good enough.

Sophisticated version

  1. Approximate each range with a line or a polynomial curve of low degree <= 4.

    • Map the indices of the the range into the unit interval, such that e.g. [103, 104, 105, 106, 107] becomes [0.0, 0.25, 0.5, 0.75, 1.0]
    • Split the range data into a range of x and y coordinates.
    • Approximate the x and y data separately as 1D-function to express the curve data as a parametric function (x(t), y(t)) with t from [0, 1] (using the mapped indices from above as interpolation knots).
    • Use a polynomial solver to solve y(t) == 0.
    • For each zero t_zero inside [0, 1], evaluate the approximation funtcion x(t) at t_zero. The inverse coordinate transformation A_inv(x(t_zero), 0) gives you an approximation of the intersection point at t_zero in your original coordinates.

If you can confirm, that this solution may suit your problem, I may provide an according numpy example.

code_onkel
  • 2,759
  • 1
  • 16
  • 31