2

I am trying to write output from R to Latex. I expect to get nicely formatted table from R:

raw

When I use latex() function from Hmisc package, I get this:

enter image description here

How can I transpose the table, making it 2x6 instead of 6x2? I know that there must exist some parameter for this in latex() function, but I can not figure this out.

Zheyuan Li
  • 71,365
  • 17
  • 180
  • 248
Moysey Abramowitz
  • 352
  • 1
  • 7
  • 19
  • My question is not how to change appearance of the output of "summary(all_vars_zb1[[1]])" in R console, but how to create Latex version of this table, with the same dimensions as in R console. No matter which table in R I use (summary(all_vars_zb1[[1]]) - 2x6 or as.matrix(summary(all_vars_zb1[[1]])), 6x2), output of latex() function is the same - 6x2 table. So my question is about how to make latex() function produce output in Latex with the same dimensions as R object. – Moysey Abramowitz Jun 22 '16 at 04:44
  • 2
    You can transpose the `summary` object, and `latex` will form the table the way you wish. `a <- rnorm(1000)` `Hmisc::latex(t(summary(a)))` – Tad Dallas Jun 22 '16 at 05:03

2 Answers2

2

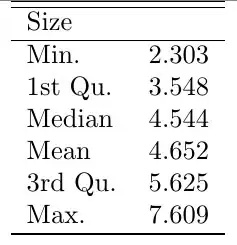
Summary returns a weird character string that is just plain ugly in my opinion. Here's an alternative for getting similar summary output in a table:

summ <- function(x){
    tmp<-quantile(x, c(0,.25,.5,.75,1))
    names(tmp)<-c("Min", "1st Qu.", "Median", "3rd Qu.", "Max")
    return(tmp)}

Sapply data with the function to return more flexible data.frame:

t(sapply(swiss, summ) )

                   Min 1st Qu. Median 3rd Qu.   Max
Fertility        35.00  64.700  70.40  78.450  92.5
Agriculture       1.20  35.900  54.10  67.650  89.7
Examination       3.00  12.000  16.00  22.000  37.0
Education         1.00   6.000   8.00  12.000  53.0
Catholic          2.15   5.195  15.14  93.125 100.0
Infant.Mortality 10.80  18.150  20.00  21.700  26.6

With @pachamaltese answer above, the final summary table should be free of the unncessary Min. : within the table.

Adam Quek
  • 6,973
  • 1
  • 17
  • 23
1

You should provide a MWE :)

What I did is this

setwd("/myfolder")    
library(Hmisc)
table <- summary(swiss)
table_transpose <- t(table)

latex(table)
latex(table_transpose)

"t" means transpose and it is applicable to a matrix or a table

After running latex() R saves two .tex files that I have to paste in a file with a suitable structure or it won't compile.

This is the final .tex

\documentclass[12pt,letterpaper,landscape]{article}
\leftmargin=0.25in
\oddsidemargin=0.25in
\textwidth=6.0in
\topmargin=-0.9in
\textheight=9.25in
\usepackage[margin=1in]{geometry}

\begin{document}

\begin{table}[!tbp]
\begin{center}
\begin{tabular}{lllllll}
\hline\hline
\multicolumn{1}{l}{table}&\multicolumn{1}{c}{}&\multicolumn{1}{c}{}&\multicolumn{1}{c}{}&\multicolumn{1}{c}{}&\multicolumn{1}{c}{}&\multicolumn{1}{c}{}\tabularnewline
\hline
  Fertility&Min.   :35.00  &1st Qu.:64.70  &Median :70.40  &Mean   :70.14  &3rd Qu.:78.45  &Max.   :92.50  \tabularnewline
 Agriculture&Min.   : 1.20  &1st Qu.:35.90  &Median :54.10  &Mean   :50.66  &3rd Qu.:67.65  &Max.   :89.70  \tabularnewline
 Examination&Min.   : 3.00  &1st Qu.:12.00  &Median :16.00  &Mean   :16.49  &3rd Qu.:22.00  &Max.   :37.00  \tabularnewline
  Education&Min.   : 1.00  &1st Qu.: 6.00  &Median : 8.00  &Mean   :10.98  &3rd Qu.:12.00  &Max.   :53.00  \tabularnewline
   Catholic&Min.   :  2.150  &1st Qu.:  5.195  &Median : 15.140  &Mean   : 41.144  &3rd Qu.: 93.125  &Max.   :100.000  \tabularnewline
Infant.Mortality&Min.   :10.80  &1st Qu.:18.15  &Median :20.00  &Mean   :19.94  &3rd Qu.:21.70  &Max.   :26.60  \tabularnewline
\hline
\end{tabular}\end{center}
\end{table}

\begin{table}[!tbp]
\begin{center}
\begin{tabular}{lllllll}
\hline\hline
\multicolumn{1}{l}{summary}&\multicolumn{1}{c}{  Fertility}&\multicolumn{1}{c}{ Agriculture}&\multicolumn{1}{c}{ Examination}&\multicolumn{1}{c}{  Education}&\multicolumn{1}{c}{   Catholic}&\multicolumn{1}{c}{Infant.Mortality}\tabularnewline
\hline
&Min.   :35.00  &Min.   : 1.20  &Min.   : 3.00  &Min.   : 1.00  &Min.   :  2.150  &Min.   :10.80  \tabularnewline
&1st Qu.:64.70  &1st Qu.:35.90  &1st Qu.:12.00  &1st Qu.: 6.00  &1st Qu.:  5.195  &1st Qu.:18.15  \tabularnewline
&Median :70.40  &Median :54.10  &Median :16.00  &Median : 8.00  &Median : 15.140  &Median :20.00  \tabularnewline
&Mean   :70.14  &Mean   :50.66  &Mean   :16.49  &Mean   :10.98  &Mean   : 41.144  &Mean   :19.94  \tabularnewline
&3rd Qu.:78.45  &3rd Qu.:67.65  &3rd Qu.:22.00  &3rd Qu.:12.00  &3rd Qu.: 93.125  &3rd Qu.:21.70  \tabularnewline
&Max.   :92.50  &Max.   :89.70  &Max.   :37.00  &Max.   :53.00  &Max.   :100.000  &Max.   :26.60  \tabularnewline
\hline
\end{tabular}\end{center}
\end{table}

\end{document}

And this is the result that needs some makeup

enter image description here

Check here for more tools like xtable Tools for making latex tables in R

Community
  • 1
  • 1
pachadotdev
  • 3,345
  • 6
  • 33
  • 60