thanks for reading my question !
I created plot using Pyplot, this is my data :
Length of "point" array is : 114745
Length of "id_item" array is : 114745
Length of "sessions" array is : 92128
And this is my code :
point = []
id_item = []
sessions = [] # temp_dict.keys()

for item in cursor_fromCompanyDB:
    sessions.append(item['sessionId'])
    for object_item in item['objects']:
        point.append(object_item['point'])
        id_item.append(object_item['id'])


plt.figure()
plt.title('Scatter Point and Id of SessionId', fontsize=20)
plt.xlabel('point', fontsize=15)
plt.ylabel('Item', fontsize=15)
plt.scatter(point, id_item, marker = 'o')
plt.autoscale(enable=True, axis=u'both', tight=False)

for label, x, y in zip(sessions, point, id_item):
    plt.annotate(label, xy = (x, y))

plt.show()
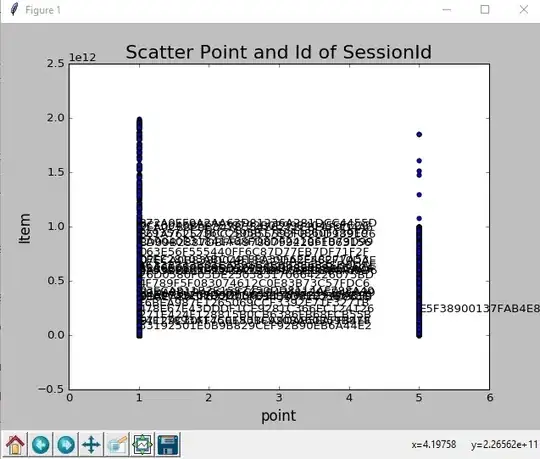
And this is result :
As you can see, values very close and hard to see.
I want value in id_item show full value and values in the center (sessions) easy to see.
Thanks very much to help me.

