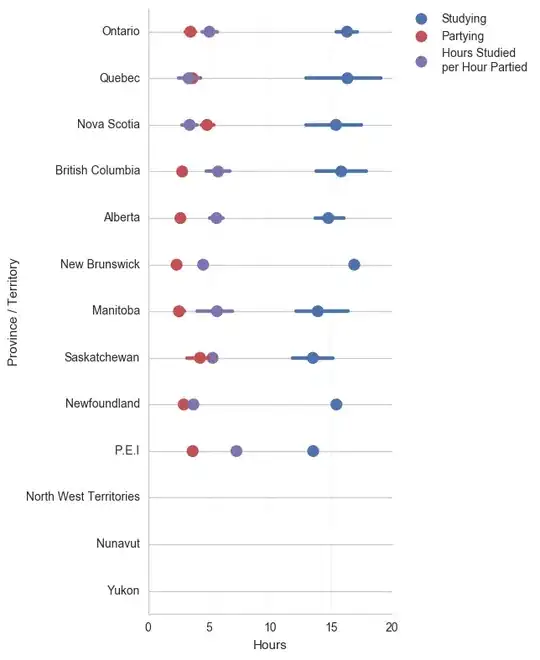
Using Seaborn's pointplot I have created the following image:
I was wondering if I could change the size of each marker to be a unique value.
The image was made by calling
sns.pointplot(x = 'Partying',
              y = 'Province',
              ci =95,
              data = df,
              join = False,
              ax = ax,
              color = pal[2],


              )
I thought maybe passing an array into the scale argument would work, but it didn't.

