public class createLineChartForSandSoil {

    static JFreeChart chart;
    public static XYSeries series;

    public static void createLineChartForSandSoil(Document document) throws DocumentException, BadElementException, IOException {
        Paragraph wordDegreeOfHeterogeneity = new Paragraph("Визначаємо ступінь неоднорідності піску:", smallFont);
        document.add(wordDegreeOfHeterogeneity);

        ChartPanel chartPanel = createChartPanel();
        int width = 450;
        int height = 350;
        XYPlot plot = chart.getXYPlot();
        XYLineAndShapeRenderer renderer = new XYLineAndShapeRenderer();
        renderer.setSeriesPaint(0, Color.BLACK);
        plot.setRenderer(renderer);
        plot.setOutlinePaint(Color.WHITE);
        plot.setBackgroundPaint(Color.WHITE);
        plot.setRangeGridlinesVisible(true);
        plot.setRangeGridlinePaint(Color.GRAY);
        plot.setDomainGridlinesVisible(true);
        plot.setDomainGridlinePaint(Color.GRAY);

        File lineChart = new File("D:/LineChart.png");
        ChartUtilities.saveChartAsPNG(lineChart, chart, width, height);
        Image img = Image.getInstance("D:/LineChart.png");
        img.scalePercent(60f);
        document.add(img);
    }

    private static XYDataset createDataset() {
        XYSeriesCollection dataset = new XYSeriesCollection();
        series = new XYSeries("");

        series.add(2.0, sumOfParticlesLess_ValueMoreThan2);
        series.add(1.0, sumOfParticlesLess_Value1_2);
        series.add(0.5, sumOfParticlesLess_Value05_1);
        series.add(0.25, sumOfParticlesLess_Value025_05);
        series.add(0.1, sumOfParticlesLess_Value01_025);
        series.add(0.0, 0.0);

        dataset.addSeries(series);

        return dataset;
    }

    private static ChartPanel createChartPanel() {
        String chartTitle = "";
        String xAxisLabel = "Діаметр частинок d, мм";
        String yAxisLabel = "Сума частинок, %";

        XYDataset dataset = createDataset();

        chart = ChartFactory.createXYLineChart(chartTitle, xAxisLabel, yAxisLabel, dataset, PlotOrientation.VERTICAL, false, false, false);

        return new ChartPanel(chart);
    }
}
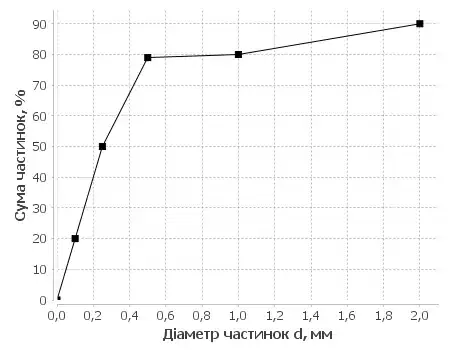
How can I get the value on X axis (hotrizontal) in the point Y=60? Methods .getAnnotationX() and .getAnnotationY() doesn't work, don't know why (cannot find method). Can somebody help me?
