First, I'd recommend watching WWDC 2013 Fixing Memory Problems and WWDC 2012 iOS App Performance: Memory videos. They are dated, yet still relevant, demonstrating of taking the above screen snapshot down to the next level in order to identify the underlying source of the memory issue.
That having been said, I have a couple of observations:
In my experience, nowadays, the problem is rarely "leaked memory" (i.e. memory that has been allocated, for which there are no more references, but you neglected to free it). It's rather hard to leak in Swift (and if you use the static analyzer on Objective-C code, the same it true there, too).
The more common problem is "abandoned memory" resulting from strong reference cycles, repeating timers not getting invalidated, circular references between view controller scenes, etc. These won't be identified by the Leaks tool. Only by digging into the Allocations tool.
First, I often like to see what accounts for the bulk of the abandoned memory. So I double click on a top level call tree and it will show me where the abandoned memory was allocated:
Note, this doesn't tell me why this was abandoned, but by knowing where the bulk of the abandoned memory was allocated, it gives me some clues (in this example, I'm starting to suspect the SecondViewController).
I then drill into the generations results and start by looking for my classes in the allocations (you can also do this by manually selecting a relevant portion of the allocations graph, as discussed here). I then filter the results, searching for my classes here. Sure, this won't always be the most significant allocation, but in my experience this sort of abandoned memory almost always stems from some misuse of my classes:
Again, this is pointing me to that SecondViewController class.
Note, when looking at generations, I generally ignore the first one or two generations because they may have false positives stemming from the app "warming up". I focus on the latter generations (and make sure that I only "mark" a generation when the app has been returned to some-steady, quiescent state.
For the sake of completion, it's worth pointing out that it's sometimes useful running Instruments with the "Record reference counts" feature on the unreleased allocation:
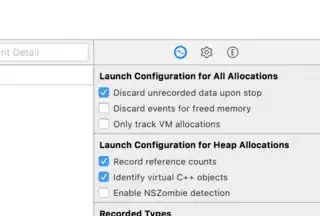
If you do that, you can sometimes drill into the list of retain and release calls and identify who still has the strong reference (focus on unpaired retain/release calls). In this case it's not very useful because there are just too many, but I mention in because sometimes this is useful to diagnose who still has the strong reference:

If you're using Xcode 8, it has a brilliant object graph debugger that cuts through much of this, graphically representing the strong references to the object in question, for example:

From this, the problem jumps out at me, that I not only have the navigation controller maintaining a reference to this view controller, but a timer. This happens to be a repeating timer for which I neglected to invalidate. In this case, that's why this object is not getting deallocated.
In the absence of Xcode 8's object graph debugger, you're left to pouring through the retain and release references (and you can look at where each of those strong references were established and determine if they were properly released) or just looking through my code for things that might be retaining that particular view controller (strong reference cycles, repeating timers, and circular view controller references are the most common problems I see).


