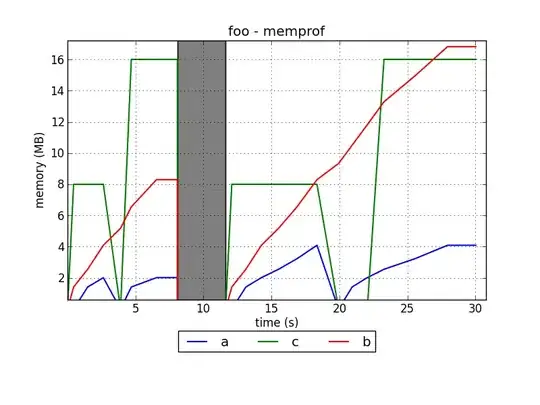
I have a series of intraday measurements. measurements are only taken during daytime on weekdays. when I plot the data, pandas extends the xaxis over the full time horizont, so the plot shows data gaps
dfb.loc[:,("value", "exp_1")].plot()
I can tell pandas/matplotlib to ignore the index and the plot is fine, but I would like to present the dates on the x axis
dfb.loc[:,("value", "exp_1")].plot(ignore_index=True)
I also tried to define the xticks with my index, but that leads to teh first chart with a cluttered x axis description
dfb.loc[:,("value", "exp_1")].plot(xticks=dfb.index)
Is there a way to get a plot like the 2nd plot while keeping the dates?
EDIT: Here is a subset of the data and the plot


