-1

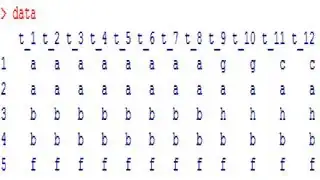
I have a matrix in which each element is a pure categorical variable "a","b","c","d",... Each column of the matrix is a chronological entry and now I want to plot the matrix by row and I hope the y-axis is the sequence of characters.

Here is the original matrix:

Graph with legend

Here is what I wanted the plot to be: Graph with legend

The red plot is first row of the matrix and the blue plot is the fifth.

I have tried some existing packages but mostly they require me to transfer the categorical variables to numerical variables. So I wonder if anyone could help me with this. Many thanks!

Zheyuan Li
  • 71,365
  • 17
  • 180
  • 248
Chao Liu
  • 23
  • 3
  • 1
    if you could give us a table we can use that would be easier to help. For instance do `dput(your_data)`. – Rhesous Aug 17 '16 at 12:56
  • Hi, thank you so much for your prompt reply, I did not figure out how to add pictures or tables, I wonder if I can send the table to your email? Many thanks! – Chao Liu Aug 17 '16 at 12:58
  • By the way, can you see the pictures (through the link in my post)? – Chao Liu Aug 17 '16 at 12:59
  • I edited your post (it must be validated before been displayed) so the images will be displayed, but for the moment we can see them by clicking on the link. We don't need the full database, juste write `dput(head(data,n=20))` (if data is the name of your database) and copy past the result that appears on your R console. – Rhesous Aug 17 '16 at 13:12
  • Fantastic! Thanks a lot. – Chao Liu Aug 17 '16 at 13:17

1 Answers1

1

Without your data, I have to generate some toy one, called mat, with 5 rows and 10 columns, filled with letters[1:7].

set.seed(0); mat <- matrix(sample(letters[1:7], 5 * 10, TRUE), nrow = 5)
#     [,1] [,2] [,3] [,4] [,5] [,6] [,7] [,8] [,9] [,10]
#[1,] "g"  "b"  "a"  "f"  "f"  "b"  "c"  "f"  "c"  "d"  
#[2,] "b"  "g"  "b"  "d"  "g"  "c"  "d"  "e"  "f"  "f"  
#[3,] "c"  "g"  "b"  "f"  "b"  "a"  "e"  "f"  "e"  "a"  
#[4,] "e"  "e"  "e"  "g"  "e"  "c"  "d"  "a"  "f"  "d"  
#[5,] "g"  "e"  "c"  "c"  "a"  "g"  "b"  "f"  "d"  "f"  

Basically you need first re-represent you character matrix mat with integers.

## flatten your object into a vector first
if (is.matrix(mat)) v <- as.character(mat)
if (is.data.frame(mat)) v <- as.character(unlist(mat, use.names = FALSE))
lev <- sort(unique(v))    ## sorted unique labels

## re-representation
mat_int <- matrix(match(v, lev), nrow = nrow(mat))
## or: mat_int <- matrix(as.integer(factor(v, levels = lev)), nrow = nrow(mat))

#     [,1] [,2] [,3] [,4] [,5] [,6] [,7] [,8] [,9] [,10]
#[1,]    7    2    1    6    6    2    3    6    3     4
#[2,]    2    7    2    4    7    3    4    5    6     6
#[3,]    3    7    2    6    2    1    5    6    5     1
#[4,]    5    5    5    7    5    3    4    1    6     4
#[5,]    7    5    3    3    1    7    2    6    4     6

Then you just plot (the whole or some rows of) this matrix using matplot. Disable the y-axis first then add it later using axis so that you can customize axis labels.

## this plots the whole matrix
matplot(t(mat_int), yaxt = "n", type = "l", xlab = "time", ylab = "category")
axis(2, seq_along(lev), labels = lev)

## this plots 1st and 5th rows
matplot(t(mat_int)[, c(1,5)], yaxt = "n", type = "l", xlab = "time", ylab = "category")
axis(2, seq_along(lev), labels = lev)

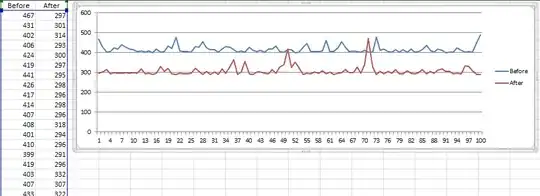
Plot of the selected two rows:
enter image description here

Zheyuan Li
  • 71,365
  • 17
  • 180
  • 248