14

In Atom, I'm able to debug installed extensions by opening the developer tools (Option+Cmd+I) and browsing through JavaScript files in ~/.atom/packages, e.g.

Atom developer tools

Is it possible to do this in VSCode? After opening the developer tools via Help -> Toggle Developer Tools, the only extension-related files I can find are the icon images:

VSCode developer tools

Mike Lischke
  • 48,925
  • 16
  • 119
  • 181
Spencer
  • 1,161
  • 12
  • 19

4 Answers4

15

1. Find the extension host process's PID:

$ PID=$(pgrep -f "^/Applications/Visual Studio Code\.app/.*--type=extensionHost")
$ echo $PID
35791

Argument -f tells pgrep to match the pattern against the full process argument string, not just the process name.

2. Send SIGUSR1 to the extension host Node process to tell it to start listening for debugger connections:

$ kill -SIGUSR1 $PID

(This produces no output.)

3. Find which port the process started listening on using lsof:

$ lsof -p $PID -a -i4tcp
COMMAND     PID        USER   FD   TYPE             DEVICE SIZE/OFF NODE NAME
Code\x20H 35791 tim.vergenz   58u  IPv4 0x8af67df8a9aa26a8      0t0  TCP localhost:63767 (LISTEN)

Argument explanations:

  • -p means filter by PID
  • -i4tcp means filter by Internet address (4tcp means only IPv4 / tcp protocl)
  • the -a in between combines the two filters via AND instead of the default OR

In the "NAME" column you'll find the host and port that your VS Code extension host process is listening on -- i.e. in the example above, localhost:63767.

4. Open Chrome Devtools, and add the debug address under Devices > Discover network targets > Configure.

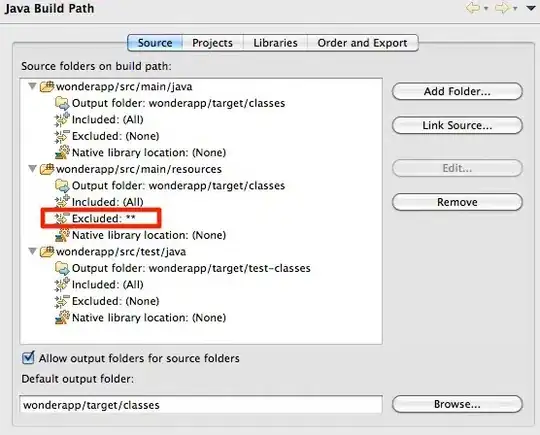
Chrome Devtools @ chrome://inspect

add debugger address from step 3

5. Open your new debug target:

connect to new debug target

You may need to manually add ~/.vscode/extensions to your workspace in order to browse files and add breakpoints:

add folder to workspace

... and click "Allow" to grant it permission:

allow devtools to access ~/.vscode/extensions

Success!

success! VS Code extensions now show in devtools

vergenzt
  • 9,669
  • 4
  • 40
  • 47
  • 1
    Awesome answer! Is there a way to inspect network requests generated by an extension? I am getting an unhelpful error message from an extension after it makes a network request ("invalid time value" with no additional info). I was hoping I could use this method to inspect network requests made by the extension, but it doesn't seem that there is a "network" tab on the inspector? – Kyle Pittman Jun 09 '21 at 15:30
  • 1
    @Monkpit I'm not aware of any way to debug VS Code extension network requests specifically, other than the ways one would do the same for Node / other processes in general via http/s proxies. Some references I found from googling "nodejs process inspect network requests" (have not tested any of them personally): https://httptoolkit.tech/javascript/ and https://stackoverflow.com/questions/28873332/how-to-monitor-the-network-on-node-js-similar-to-chrome-firefox-developer-tools – vergenzt Jun 23 '21 at 13:07
  • Can also get the PID from "Terminal > Output > Extension Host" in VSCode. – Michael Jun 02 '23 at 11:02
2

Your code doesn't show in the main developer tools because VSCode unfortunately runs extensions in a separate process called the Extension Host.

You can go to Help > Process Explorer to look up the Extension Host process id, then kill -sigusr1 it to turn on its debugger (like any node process). Then in Chrome, go to chrome://inspect and you should see the process (it won't look very recognizable, the name will be something like /private/var/folders/f3/zmhpprp15zxfd1s3fpp3prm80000gn/T/AppTranslocation/C0D80599-1ECA-4802-A110-A1…)

I'm not 100% sure if all extension code is available in that debugger because it has subprocesses, but so far I've been able to set breakpoints in some of my installed extensions.

Andy
  • 7,885
  • 5
  • 55
  • 61
  • These instructions are very hard to understand. What do you mean by "in Chrome"? VSCode is an entirely separate process, how do I get to its `chrome://inspect` page? – kynan Jun 28 '20 at 11:48
  • Also: `chrome://inspect` has many tabs. Which one do I need? – kynan Jun 28 '20 at 11:55
  • Sorry i didn't get notifications about this, Chrome has an embedded V8 javascript engine and also an embedded V8 debugger (Chrome inspector). Since node also uses V8 under the hood, Chrome inspector can attach to remote node processes (even on a different machine!) if the node process is listening for debug connections on a port, which defaults to 9229. – Andy Nov 26 '20 at 18:12
  • I'm kind of confused what you mean by tabs, but usually when I put a node process into debug mode it show up somehow in the list of processes that can be debugged, and i click the "inspect" link for that process – Andy Nov 26 '20 at 18:14
  • This is what `chrome://inspect` looks like: https://ibb.co/W60bxsb I've sent the extensionHost process a `SIGUSR1`, but where do I go now? – kynan Nov 26 '20 at 22:36
  • That's too bad, the process info should automatically show up below "Remote Targets". I don't know why it isn't, i guess you'll have to search for help on that – Andy Nov 27 '20 at 23:22
0

Due to how VS Code implements its debugging UI and debug protocol it's not not possible (but I'm not 100% certain about this).

Debug adapters are part of VS Code's extensible architecture: they are contributed as extensions. What sets them apart from other extensions is the fact that the debug adapter code is not running in the extension host, but as a separate standalone program.

You can easily run an extension under the debugger thought. You'll need extension source files and debugger launch configuration.

You can find more about running and debugging extensions in the VS Code documentation.

You can also check the example extension wordcount for launch configuration.

Jakub Synowiec
  • 5,719
  • 1
  • 29
  • 37
0

I hope this will help you in vs code extension development you can set up debugging env in this way

  1. create folder with the name .vscode
  2. in this folder create json file named launch.json
  3. in the json file you need this script
    {
        "version": "0.2.0",
        "configurations": [
            {
                "name": "Extension",
                "type": "extensionHost",
                "request": "launch",
                "runtimeExecutable": "${execPath}",
                "args": [
                    "--extensionDevelopmentPath=${workspaceFolder}"
                ]
            }
        ]
    }

  1. then you press F5 vs code will launch new window with your extension installed
  2. in the new window CTRL+SHIFT+P
  3. search for "toggle developer tools "

if the extension is not for you you need just to run steps 5 & 6

Mike Lischke
  • 48,925
  • 16
  • 119
  • 181
Nadim Al Abdou
  • 768
  • 7
  • 13
  • 2
    This is *not* answering the OP's question, which is "how do I debug an *installed* extension", not one I'm developing. – kynan Jun 28 '20 at 12:06