As a side note, I'm really shocked how sparse the documentation is for this package.
The function get_selected() returns a vector, as it can be seen in the GitHub code. I am going to use format = "slices".
Consider the following code:
library(shiny)
library(shinyTree)
ui <- shinyUI(
  shiny::fluidPage(
    h4('Shiny hierarchical checkbox'),
    shinyTree("tree", checkbox = TRUE),
    # table of weights
    fluidRow(column("",
                    tableOutput("Table"), width = 12,
                    align = "center"))
  )
)
server <- shinyServer(function(input, output, session) {
  output$tree <- renderTree({
    sss=list(  'I lorem impsum'= list(
      'I.1 lorem impsum'   =  structure(list('I.1.1 lorem impsum'='1', 'I.1.2 lorem impsum'='2'),stopened=TRUE),
      'I.2 lorem impsum'   =  structure(list('I.2.1 lorem impsum'='3'), stopened=TRUE)))
    attr(sss[[1]],"stopened")=TRUE
    sss
  })
  output$Table <- renderPrint({

    names(as.data.frame(get_selected(input$tree, format = "slices")))

  })
})
shinyApp(ui, server)
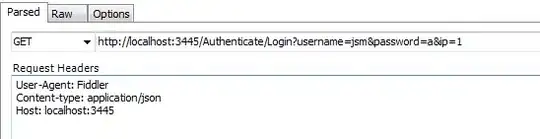
Upon selecting I.1.2. lorem impsum, the following is returned:
This is a vector of length 1 with the column name. Notice that dots are being used instead of spaces.
Thus, if we want to set a variable x equal to 4 when this is selected, we should see if I.1.2.lorem.impsum is in the names above, and then perform the assignment.
library(shiny)
library(shinyTree)
ui <- shinyUI(
  shiny::fluidPage(
    h4('Shiny hierarchical checkbox'),
    shinyTree("tree", checkbox = TRUE),
    fluidRow(column("",
                    tableOutput("Table"), width = 12,
                    align = "center")),
    fluidRow(column("",
                    tableOutput("Table2"), width = 12,
                    align = "center"))
  )
)
server <- shinyServer(function(input, output, session) {
  output$tree <- renderTree({
    sss=list(  'I lorem impsum'= list(
      'I.1 lorem impsum'   =  structure(list('I.1.1 lorem impsum'='1', 'I.1.2 lorem impsum'='2'),stopened=TRUE),
      'I.2 lorem impsum'   =  structure(list('I.2.1 lorem impsum'='3'), stopened=TRUE)))
    attr(sss[[1]],"stopened")=TRUE
    sss
  })

  x <- reactive({
    if('I.1.2.lorem.impsum' %in% names(
      as.data.frame(
        get_selected(
          input$tree, format = "slices")))){

      x <- 4

    }
  })


  output$Table <- renderPrint({

    names(as.data.frame(get_selected(input$tree, format = "slices")))

  })

  output$Table2 <- renderTable({

    as.data.frame(x())

  })
})
shinyApp(ui, server)
giving
as desired.


