4

I have a C++ program I am trying to optimize. Since I want it to run fast, I am not using a lot of function calls. Most profiling tool I have seen can give you profiling info in a function-call resolution. However, I would like it in a line-by-line resolution. Is there some option like this?

I am using Visual Studio 2010 on Windows.

Thanks.

R S
  • 11,359
  • 10
  • 43
  • 50
  • using only VS2010 or would another tool be ok? – dutt Oct 13 '10 at 09:16
  • I guess I can use something else, although I'd like to spend little time on trying to find out how that something else works technically, messing with compiler options, etc. – R S Oct 13 '10 at 09:27
  • 5
    Be warned. After the optimiser has had its hands on your code, there is no longer a clear 1-to-1 relation between the assembly instructions and the lines in the source code. One line can correspond to multiple assembly operations that are not located close to each other and one assembly instruction may come from multiple lines at the same time. – Bart van Ingen Schenau Oct 13 '10 at 09:33
  • "not using a lot of function calls" - if you've got small steps like maths calculations and you're really focused on a single function, then the profiling may ruin your parallelism and performance anyway - do try it, but also run the core loops a few thousand/million times and measure elapsed time, then experiment with all the alternative implementations you can think of. You might consider porting to Linux and trying valgrind, as you could uncover some some perforamnce issues that are inherent in the CPU / memory architecture etc.. – Tony Delroy Oct 13 '10 at 10:00
  • Ruele 8: Don't optimize prematurely (http://www.gotw.ca/publications/c++cs.htm). Use your profiler and confirm that function calls slow you down before worrying about eliminating them. Functions help you group calculations and possibly find bigger optimizations in your algorithms. Optimizers can often do their job better on smaller chunks of code. – gregg Oct 13 '10 at 13:33

4 Answers4

3

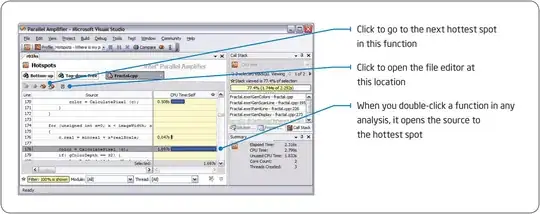
Intel Parallel Amplifier should be capable of what you want. If that is what you want:

amplifier

Keynslug
  • 2,676
  • 1
  • 19
  • 20
2

If you're running with on an AMD processor, CodeAnalyst is free and can do that (at least, in time-based profiling); you can actually "zoom" in and out seeing what is taking the most CPU time from processes to functions down to single assembly instructions.
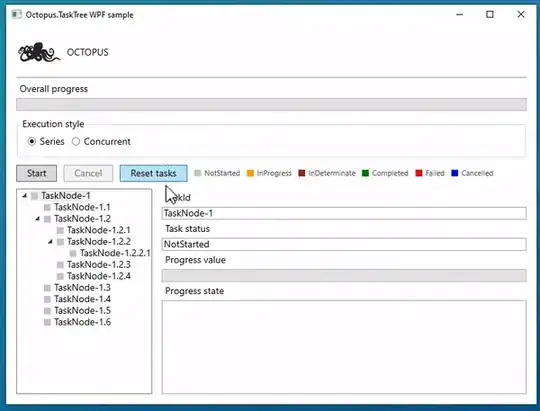
CodeAnalyst window

However, keep in mind that to get meaningful results to that resolution with time-based profiling you should run the critical part of the code several times, otherwise the statistics you get doesn't have much sense.

By the way, in my opinion you should forget about the less function calls=>faster idea. If the cost of a function call is bigger than its "payload", the compiler should be able to figure out by itself if it's convenient to inline the call, and in some cases even inlining too much can slow down the code.
Matteo Italia
  • 123,740
  • 17
  • 206
  • 299
  • Time-based profiling in CodeAnalyst works with other processors too. – Timo Oct 13 '10 at 10:57
  • There is a bigger cost to functions than the cycles spent in entering and leaving them. The bigger cost is that they are like a credit card, encouraging you to use them more than might be wise. When this tendency is compounded over a few layers, it doesn't take much laxity of judgement to add up to a significant problem. – Mike Dunlavey Oct 13 '10 at 13:33
2

AQTime is a commercial profiler for Windows and I have found it to work pretty well for both function and line timings. One thing I like about it is that you do not have to fiddle with compiler options or Visual Studio settings -- i.e. you do not need any additional compiler options to enable profiling: All you need to do the profiling is the pdb (symbol) file and the executable. (And yes, you can create a pdb file for your release-compile.)

Martin Ba
  • 37,187
  • 33
  • 183
  • 337
1

IMHO, this method is best, for these reasons, and here's an example of a 43x speedup. It's not a well-known technique, except to a small number of people, for one example, and another, and another. You may be surprised that it's very low-tech and manual, but you can't beat the results.

Oh, and by the way, for Visual Studio, LTProf may well be the next best thing. It gives you line-level percents, derived from stack samples taken at random wall-clock times. Don't get sucked in by a lot of fancy UI options or promises of accuracy of timing. Those things don't matter. What matters is that it pinpoints the spots worth optimizing.

Community
  • 1
  • 1
Mike Dunlavey
  • 40,059
  • 14
  • 91
  • 135