I have a set of polygons, an reproducable example here from code in this question:
# polygons
square <- t(replicate(8, {
o <- runif(2)
c(o, o + c(0, 0.1), o + 0.1, o + c(0.1, 0), o)
}))
ID <- paste0('sq', seq_len(nrow(square)))

# Create SP
polys <- SpatialPolygons(mapply(function(poly, id) {
xy <- matrix(poly, ncol=2, byrow=TRUE)
Polygons(list(Polygon(xy)), ID=id)
}, split(square, row(square)), ID))

# Create SPDF and add a column for values
polys.df <- SpatialPolygonsDataFrame(polys, data.frame(id=ID, row.names=ID))
polys.df@data$number <- c(1,2,3,4,5,6,7,8)
I then want to plot these with a single color palette, but want the highest numbers to be dark rather than light as in the default. After fortifying to use ggplot
f.polys = fortify(polys.df, region='id')
f.polys = merge(f.polys, polys.df@data, by.x='id', by.y='id')
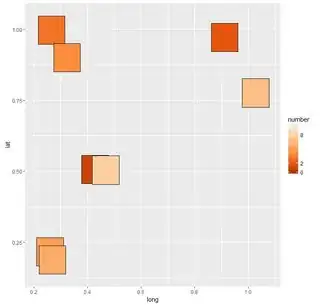
I attempted to plot using a couple scale_fill_distiller options. So, this code works to set legend bar limits but doesn't reverse the palette:
ggplot() +
geom_polygon(data = f.polys, aes(x = long, y = lat, fill=number, group = group), color = 'black') +
scale_fill_distiller(palette = "Oranges", limits = c(0,10), breaks=c(0,2,8))
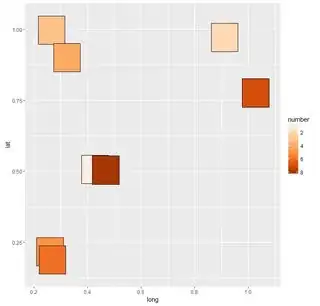
And this code reverses the palette, without being able to assign limits and breaks:
ggplot() +
geom_polygon(data = f.polys, aes(x = long, y = lat, fill=number, group = group), color = 'black') +
scale_fill_distiller(palette = "Oranges", trans = 'reverse')
When I try to combine the scale_fill_distiller arguments the palette does not reverse and I lose the scale bar. Any recommendations?
ggplot() +
geom_polygon(data = f.polys, aes(x = long, y = lat, fill=number, group = group), color = 'black') +
scale_fill_distiller(palette = "Oranges", trans = 'reverse',limits = c(0,10), breaks=c(0,2,8))


