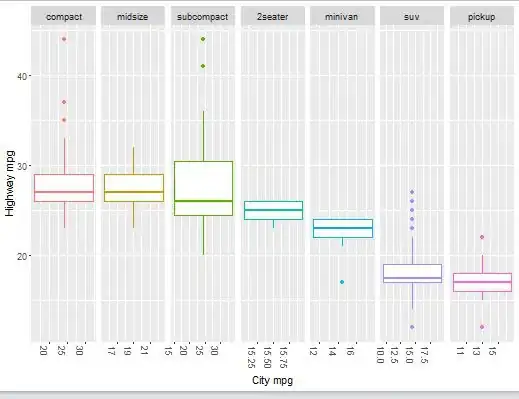
Using the dataset mpg, I am able to plot the three-way relationship between city mpg, highway mpg and class model. I use the following code (using ggplot2) which outputs the graph shown in attached file Boxplot.png.
ggplot(mpg,aes(cty,hwy))+
  aes(color=class)+
  geom_boxplot()+
  facet_grid(.~class, scales='free')+
  theme(axis.text.x = element_text(angle = -90, vjust = 1, hjust = 0))+
  scale_x_continuous('City mpg')+
  scale_y_continuous('Highway mpg')+
  theme(legend.position="none")
Question:
I want to display the boxplots in order of increasing median. How do I do it?
Can I display the median value on top each boxplot?
