I have a pandas dataframe:
--------------------------------------
|   field_0  |  field_1   | field_2  |
--------------------------------------
|     0      |   1.5      |  2.9     |
--------------------------------------
|     1      |   1.3      |  2.6     |
--------------------------------------
|       :                            |
--------------------------------------
|     1      |   2.1      |  3.2     |
--------------------------------------
|     0      |   1.1      |  2.1     |
--------------------------------------
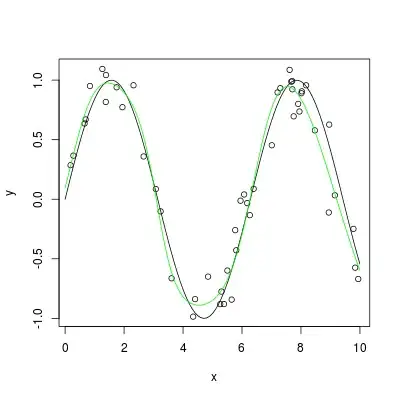
I can create a scatter plot for field_1 vs. field_2 like below:
%matplotlib notebook
import matplotlib.pyplot as plt
import matplotlib
matplotlib.style.use('ggplot')
my_df.plot(x='field_1', y='field_2', kind = 'scatter')
However, I am wondering is it possible to include field_0 in the plot? So when field_0 = 0, the point is blue; when field_1 = 1, the point is red.
Thanks!
