I have a trisurf plot that goes above and below zero. How do I change the colormap such that I color code so that portions of the surface greater than zero are blue and portions below zero are red?
Asked
Active
Viewed 6,855 times
1 Answers
5
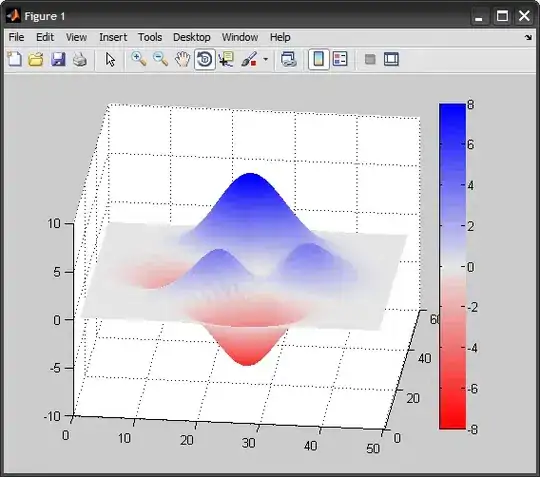
You can build such a colormap yourself. Take this example:
r = [1 0 0];       %# start
w = [.9 .9 .9];    %# middle
b = [0 0 1];       %# end

%# colormap of size 64-by-3, ranging from red -> white -> blue
c1 = zeros(32,3); c2 = zeros(32,3);
for i=1:3
    c1(:,i) = linspace(r(i), w(i), 32);
    c2(:,i) = linspace(w(i), b(i), 32);
end
c = [c1(1:end-1,:);c2];

surf(peaks), shading interp
caxis([-8 8]), colormap(c), colorbar
Amro
- 123,847
- 25
- 243
- 454