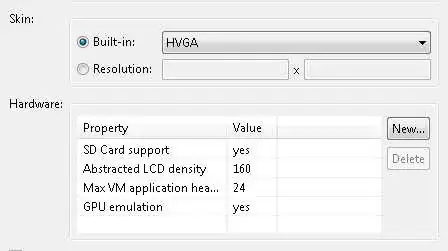
How do I plot a rectangle with color representing a value like this picture in python?

I have showed a rectangle but still trying to display values in the rectangle!
import matplotlib
import matplotlib.pyplot as plt
from matplotlib.patches import Rectangle

fig = plt.figure()
ax = fig.add_subplot(111)
rect1 = matplotlib.patches.Rectangle((0,1), 5, 0.5, color='c')

ax.add_patch(rect1)
ax.grid()
plt.xlim([-5, 20])
plt.ylim([-5, 6])

plt.show()


someX, someY = 0.5, 0.5
plt.figure()
currentAxis = plt.gca()
currentAxis.add_patch(Rectangle((someX - .1, someY - .1), 0.2, 0.2, color = 'c', alpha=0.5))
plt.grid()
plt.show()
