2

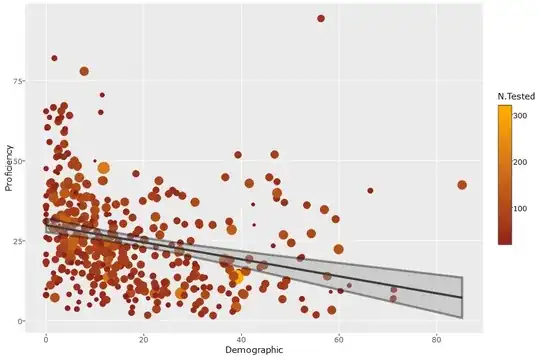
I'm building a pretty intensive plot, but I am having a basic problem with geom_smooth that I can't seem to find any answers for. Here's how the plot looks now with geom_smooth(method = "lm") :

enter image description here

When I build the geom_smooth() portion of my plot, I'd like to change the line color. When I do this, it draws new lines bordering my confidence interval,

Calling geom_smooth(method = "lm", color = "black") returns this:

enter image description here

Is there a simple way to get rid of the border lines, but keep the main line black?

EDIT: I can't provide full code with data, but have provided circumstances that will reproduce the error here. You will need no more than this to answer the question. Per the comments below, its likely an interaction with plotly (ggplotly).

library(ggplot2)
library(plotly)
df <- data.frame(
    Demographic = rnorm(1:100),
    Proficiency = rnorm(1:100),
    N.Tested = rnorm(1:100)
)

a <- ggplot(data = df, 
        aes(x = Demographic, 
            y = Proficiency)
)
b <- a + geom_point(aes(
    text = "to be replaced",
    color = N.Tested,
    size = N.Tested
),
show.legend = FALSE)
c <- b + scale_color_gradient2(low = "firebrick4", high = "gold", mid = "orange", midpoint=300)
d <- c + geom_smooth(method = "lm", color="black")

ggplotly(d)
Cyrus Mohammadian
  • 4,982
  • 6
  • 33
  • 62
Tim Bedeaux
  • 33
  • 1
  • 7
  • 2
    Can you show the full code for your plot (and maybe some sample data)? I'm trying to figure out where the borders are coming from, as that's not the default behavior. For example, this doesn't produce borders around the confidence interval: `ggplot(mtcars, aes(wt, mpg, colour=hp)) + geom_point() + geom_smooth(method="lm", colour="black") `. – eipi10 Oct 04 '16 at 22:34
  • Agree with @eipi10. we need to see the full code + data. This behaviour seems odd – dww Oct 04 '16 at 22:41
  • Excellent point, my mistake. The fix below wasn't working for me either, so it must be something outside of ggplot. My best guess now is that it's an interaction with `ggplotly()`. Full code is included in edit above. – Tim Bedeaux Oct 04 '16 at 22:45
  • so this is the output from ggplotly not ggplot??? That's a completely different scenario. Btw - I still don't see the **full code** or any data - I.e. what we need is all the lines required to cut and paste into a console and reproduce what you have – dww Oct 04 '16 at 22:48
  • This is why we ask for a **[reproducible example](http://stackoverflow.com/questions/5963269/how-to-make-a-great-r-reproducible-example)** (that is, code + data that reproduces your issue) with every question. It often saves a lot of time. – eipi10 Oct 04 '16 at 22:50
  • Please forgive my transgression. I have updated the code and simulated data in a way that will allow you to copy and paste it into your console. Please not that you will have to have both ggplot2 and plotly installed. – Tim Bedeaux Oct 04 '16 at 22:57

2 Answers2

2

You could add just the regression line via geom_smooth and add the ribbon via geom_ribbon using stat = "smooth". It adds an extra step but separating the layers allows you to color the line without messing up the confidence ribbon.

d <- c + geom_smooth(method = "lm", se = FALSE, color = "black")
e <- d + geom_ribbon(stat = "smooth", method = "lm", alpha = .15)
ggplotly(e)

enter image description here

aosmith
  • 34,856
  • 9
  • 84
  • 118
  • This is exactly what I was looking for. I knew there was a way to separate the commands, just didn't know the commands. Simple and elegant, thank you. – Tim Bedeaux Oct 05 '16 at 14:50
1

ggplotly frequently gives unexpected results. If the end product you want is a plotly graph, then it's usually best to go straight to the plotly API. Using the plotly API also gives access to a much wider range of options than ggplotly.

Unfortunately, however, plotly does not come with the convenient built in calculation of statistics that geom_smooth provides. So we begin by calculating our fit and error range using lm() and predict.lm()

lm1 = lm(Proficiency~Demographic, data=df)
lm.df = data.frame(Demographic = sort(df$Demographic), 
                   Proficiency = predict(lm1)[order(df$Demographic)],
                   se = predict(lm1, se.fit = T)$se.fit[order(df$Demographic)])
lm.df$ymax = lm.df$Proficiency + lm.df$se
lm.df$ymin = lm.df$Proficiency - lm.df$se

Now we are ready to plot, using the plotly API directly

plot_ly() %>%
  add_trace(data=df, x=~Demographic, y=~Proficiency, type="scatter", mode="markers",
            size=~N.Tested, color=~N.Tested, colors = c("#8B1A1A", "#FFA500"), showlegend=F) %>%
  add_ribbons(data=lm.df, x=~Demographic, ymin = ~ymin, ymax = ~ymax,
              line = list(color="transparent"), showlegend=F,
              fillcolor = "#77777777") %>%
  add_trace(data=lm.df, x=~Demographic, y=~Proficiency, 
          type="scatter", mode="lines", line=list(color="black"), showlegend=F) 

enter image description here

dww
  • 30,425
  • 5
  • 68
  • 111