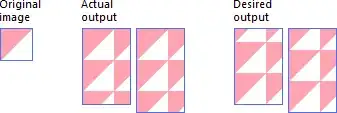
I have to plot a figure with 11 subpots as you can see below. But as it is an odd number, i dont know how to deal the subplot (4,3,12) to remove it... and place the 2 last plots on the center Moreover i would like to increse the subplot size as the space is too important. The code is below.
The code is :
plt.close()

fig, axes = plt.subplots(nrows=4, ncols=3)

plt.tight_layout(pad=0.05, w_pad=0.001, h_pad=2.0)
ax1 = plt.subplot(431) # creates first axis
ax1.set_xticks([])
ax1.set_yticks([])
ax1.tick_params(labelsize=8)
i1 = ax1.imshow(IIIm,cmap='hot',extent=(0,2000,0,2000),vmin=-0.2,vmax=-0.1)
i11 = ax1.plot((0,600),(1000,1000),'k-',linewidth=3)
cb1=plt.colorbar(i1,ax=ax1,ticks=[-0.2,-0.15,-0.1],fraction=0.046, pad=0.04,format='%.3f')
cb1.ax.tick_params(labelsize=8)
ax1.set_title("$n = -3$", y=1.05, fontsize=12)


ax2 = plt.subplot(432) # creates second axis
ax2.set_xticks([])
ax2.set_yticks([])
i2=ax2.imshow(IIm,cmap='hot',extent=(0,2000,0,2000),vmin=-0.1,vmax=0.1)
i22 = ax2.plot((0,600),(1000,1000),'k-',linewidth=3)
ax2.set_title("$n = -2$", y=1.05, fontsize=12)
ax2.set_xticklabels([])
ax2.set_yticklabels([])
cb2=plt.colorbar(i2,ax=ax2,ticks=[-0.1,0.0,0.1],fraction=0.046, pad=0.04,format='%.3f')
cb2.ax.tick_params(labelsize=8)

ax3 = plt.subplot(433) # creates first axis
ax3.set_xticks([])
ax3.set_yticks([])
i3 = ax3.imshow(Im,cmap='hot',extent=(0,2000,0,2000),vmin=-1,vmax=-0.2)
i33 = ax3.plot((0,600),(1000,1000),'k-',linewidth=3)
ax3.set_title("$n = -1$ ", y=1.05, fontsize=12)
cb3=plt.colorbar(i3,ax=ax3,ticks=[-1,-0.6,-0.2],fraction=0.046, pad=0.04,format='%.3f')
ax3.set_xticklabels([])
ax3.set_yticklabels([])
cb3.ax.tick_params(labelsize=8)
#plt.gcf().tight_layout()


#plt.tight_layout(pad=0.05, w_pad=0.001, h_pad=2.0)
ax1 = plt.subplot(434) # creates first axis
ax1.set_xticks([])
ax1.set_yticks([])
ax1.tick_params(labelsize=8)
i1 = ax1.imshow(ZV_0_modeI,extent=(0,2000,0,2000),cmap=plt.cm.hot,origin="lower", vmin=-1, vmax=1)
i11 = ax1.plot((0,600),(1000,1000),'k-',linewidth=3)
cb1=plt.colorbar(i1,ax=ax1,ticks=[-1,0, 1],fraction=0.046, pad=0.04,format='%.2f')
cb1.ax.tick_params(labelsize=8)
ax1.set_title("$ n = 0$", y=1.05, fontsize=12)


ax2 = plt.subplot(435) # creates second axis
ax2.set_xticks([])
ax2.set_yticks([])
i2=ax2.imshow(I,cmap='hot',extent=(0,2000,0,2000), vmin=-1, vmax=1)
i22 = ax2.plot((0,600),(1000,1000),'k-',linewidth=3)
ax2.set_title("$n = 1$", y=1.05, fontsize=12)
ax2.set_xticklabels([])
ax2.set_yticklabels([])
cb2=plt.colorbar(i2,ax=ax2,fraction=0.046, pad=0.04,ticks=[-1,0,1],format='%.2f')
cb2.ax.tick_params(labelsize=8)

ax3 = plt.subplot(436) # creates first axis
ax3.set_xticks([])
ax3.set_yticks([])
i3 = ax3.imshow(II,cmap='hot',extent=(0,2000,0,2000),vmin=-1,vmax=1)
i33 = ax3.plot((0,600),(1000,1000),'k-',linewidth=3)
ax3.set_title("$n = 2$ ", y=1.05, fontsize=12)
cb3=plt.colorbar(i3,ax=ax3,fraction=0.046, pad=0.04,ticks=[-1.,0,1.],format='%.2f')
ax3.set_xticklabels([])
ax3.set_yticklabels([])
cb3.ax.tick_params(labelsize=8)
plt.gcf().tight_layout()


plt.tight_layout(pad=0.05, w_pad=0.001, h_pad=2.0)
ax1 = plt.subplot(437) # creates first axis
ax1.set_xticks([])
ax1.set_yticks([])
ax1.tick_params(labelsize=8)
i1 = ax1.imshow(III,cmap=plt.cm.hot,origin="lower",extent=(0,2000,0,2000),vmin=-1, vmax=1)
i11 = ax1.plot((0,600),(1000,1000),'k-',linewidth=3)
cb1=plt.colorbar(i1,ax=ax1,ticks=[-1,0, 1],fraction=0.046, pad=0.04,format='%.2f')
cb1.ax.tick_params(labelsize=8)
ax1.set_title("$ n = 3$", y=1.05, fontsize=12)

ax2 = plt.subplot(438) # creates second axis
ax2.set_xticks([])
ax2.set_yticks([])
i2=ax2.imshow(IV,cmap='hot',extent=(0,2000,0,2000), vmin=-1, vmax=1)
i22 = ax2.plot((0,600),(1000,1000),'k-',linewidth=3)
ax2.set_title("$n = 4$", y=1.05, fontsize=12)
ax2.set_xticklabels([])
ax2.set_yticklabels([])
cb2=plt.colorbar(i2,ax=ax2,fraction=0.046, pad=0.04,ticks=[-1,0,1],format='%.2f')
cb2.ax.tick_params(labelsize=8)

ax3 = plt.subplot(439) # creates first axis
ax3.set_xticks([])
ax3.set_yticks([])
i3 = ax3.imshow(V,cmap='hot',extent=(0,2000,0,2000),vmin=-1,vmax=1)
i33 = ax3.plot((0,600),(1000,1000),'k-',linewidth=3)
ax3.set_title("$n = 5$ ", y=1.05, fontsize=12)
cb3=plt.colorbar(i3,ax=ax3,fraction=0.046, pad=0.04,ticks=[-1.,0,1.],format='%.2f')
ax3.set_xticklabels([])
ax3.set_yticklabels([])
cb3.ax.tick_params(labelsize=8)
plt.gcf().tight_layout()


plt.tight_layout(pad=0.05, w_pad=0.001, h_pad=2.0)
ax1 = plt.subplot(4,3,10) # creates first axis
ax1.set_xticks([])
ax1.set_yticks([])
ax1.tick_params(labelsize=8)
i1 = ax1.imshow(VI,cmap=plt.cm.hot,origin="lower",extent=(0,2000,0,2000),vmin=-1, vmax=1)
i11 = ax1.plot((0,600),(1000,1000),'k-',linewidth=3)
cb1=plt.colorbar(i1,ax=ax1,ticks=[-1,0, 1],fraction=0.046, pad=0.04,format='%.2f')
cb1.ax.tick_params(labelsize=8)
ax1.set_title("$ n = 6$", y=1.05, fontsize=12)

ax2 = plt.subplot(4,3,11) # creates second axis
ax2.set_xticks([0])
ax2.set_yticks([])
i2=ax2.imshow(VII,cmap='hot',extent=(0,2000,0,2000), vmin=-1, vmax=1)
i22 = ax2.plot((0,600),(1000,1000),'k-',linewidth=3)
ax2.set_title("$n = 7$", y=1.05, fontsize=12)
ax2.set_xticklabels([])
ax2.set_yticklabels([])
cb2=plt.colorbar(i2,ax=ax2,fraction=0.046, pad=0.04,ticks=[-1,0,1],format='%.2f')
cb2.ax.tick_params(labelsize=8)


plt.savefig('filtre.png', dpi=250,bbox_inches='tight', pad_inches=0.1)

plt.show()


