0

in my tomcat startup, i set -xms , -xmx to 1GB. inside visualvm when i monitor memory

  1. when i do sampling of memory, it doesnt show accurate memory usage, until, if i press 'snapshot', and then the java classes that utilizing memory showing correct patterns and instances count. why like this?

  2. also, as i set tomcat memory to 1gb, memory keep on increasing ing zip-zat and go up aroudn 960mb. until i press "perform gc" and the memory back to 200mb..

  3. do you think needed to create scheduler to force hit perform.gc() on jvm ,everday at midnight?

any comments from my description

VisualVM screenshot

Vineet Reynolds
  • 76,006
  • 17
  • 150
  • 174
cometta
  • 35,071
  • 77
  • 215
  • 324

1 Answers1

1

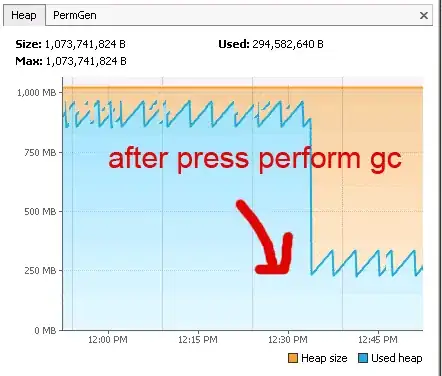
What I believe you see here is the concurrent Garbage Collector is doing young generation cleanups, but the heap is constantly churning so it can't get a hold of all the references for an old generation collection. When you hit the perform GC button you're doing a "stop-the-world" collection which blocks all the threads, freezing the heap, and allowing a much larger collection to occur. My main concerns here would be - does a large collection ever occur (after x hours)? Are you seeing OutOfMemory errors with a smaller heap?

1) Do you have the auto refresh button turned on? It may also be that profiler does a small GC (Eden space) before taking a snapshot.

2) This is perfectly normal. Garbage collection takes time and resources (processor cycles). If you've set your heap to a large size, it will wait until it reaches some percentage of that until triggering a garbage collection itself. I think the default free space to live object ratio is between 40% and 70% I know tomcat specifically changed the way it does garbage collection around version 5, tomcat v4 had performance issues because it spent a lot of time running the garbage collector. You may want to do some research here and see if tomcat has custom garbage collection options.

3) No. A nearly full heap is exactly what you're striving for. It may make sense to make the heap smaller so that a full garbage collection doesn't take such a long time. It's trade-off between lots of garbage collections (pauses) and lengthy garbage collections (long pauses). Each app is different, so I generally start with the defaults and tweak as needed. There are lots of options for garbage collection (and alternate collectors) if you're interested.

Java 5

Java 6 FAQ, Whitepaper

Steve Jackson
  • 1,330
  • 1
  • 15
  • 25
  • @steve, your question:does a large collection ever occur (after x hours)? ans:No, i run it without restarting tomcat for 2weeks. Q: are you seeing outofmemory errors with smaller heap? you want me to set the heap -xmx to smaller to see whether there is outofmemory? – cometta Oct 26 '10 at 14:28
  • @steve 1. ans: i'm not using profiler tab, i'm using the 'sampling' tab. by default the refresh button is on – cometta Oct 26 '10 at 14:29
  • I'm more interested in why you changed the heap size in the first place...have you seen any issues? – Steve Jackson Oct 26 '10 at 15:24
  • 1
    Also, you might want to try leaving -Xms out or set to a smaller value to see if you need that full 1GB. Or have you already determined you need a GB of heap? – Steve Jackson Oct 26 '10 at 15:25
  • no, just a wild guest i put -xms -xmx same. by the way, i already take out -xms. will update on my observation. anything else u want to comments? – cometta Oct 27 '10 at 01:05
  • @cometta - I think you're getting the hang of it. -Xmx sets that max number: you use that to ensure you don't have OutOfMemory errors. -Xms is more for performance: I know I need a lot of memory at startup and don't want to wait for the heap to grow on it's own. I rarely use that one. – Steve Jackson Oct 27 '10 at 13:25