What are you expecting to get by sampling from a fitted linear model object?
sample(model[i], size=300)
We want to sample from data and refit the model. I.e., by performing 2000 times we sample data 2000 times and fit 2000 regression models.
Sampling from data is the key. This would be a promising way to go, by using subset argument in lm. For any problems that require replicating a process many times, it would be convenient to first write a function doing such experiment one time.
f <- function () {
  fit <- lm(price ~ mileage, data = dat, subset = sample(nrow(dat), 300))
  coef(fit)
  }
Now, we use replicate to repeat this 2000 times to get a matrix:
z <- t(replicate(2000, f()))
replicate is based on sapply which always does cbind() you get end up with a flat matrix; for better readability I have transposed it using t() to get a long matrix.
In the following I use R's built-in dataset cars as an example. This dataset has 50 observations so we can't sample 300 out of it without replacement. I will sample 30 instead.
f <- function () {
  fit <- lm(dist ~ speed, data = cars, subset = sample(nrow(cars), 30))
  coef(fit)
  }
Running one time gives the coefficient vector. The set.seed part is just for reproducibility.
set.seed(0); f()

#(Intercept)       speed
#  -22.69112     4.18617
By replicating this, say 50 times, we get a matrix:
set.seed(0); z <- t(replicate(50, f()))

head(z)   ## show first few rows

#     (Intercept)    speed
#[1,]   -22.69112 4.186170
#[2,]   -21.31613 4.317624
#[3,]   -12.98734 3.454305
#[4,]   -22.59920 4.274417
#[5,]   -22.53475 4.584875
#[6,]   -18.88185 4.104758
The distribution of the coefficients can be roughly assessed by histogram:
par(mfrow = c(1,2))
hist(z[,1], main = "intercept")
hist(z[,2], main = "slope")
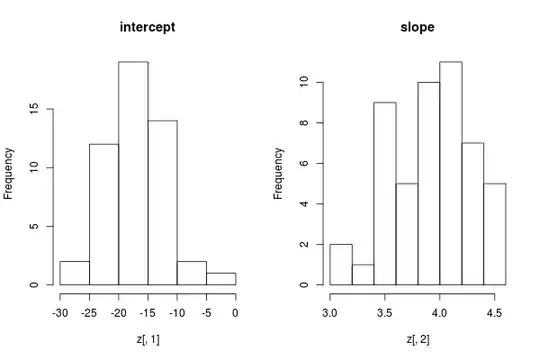
The result looks rough, because I did not do many replications.
