1

enter image description here

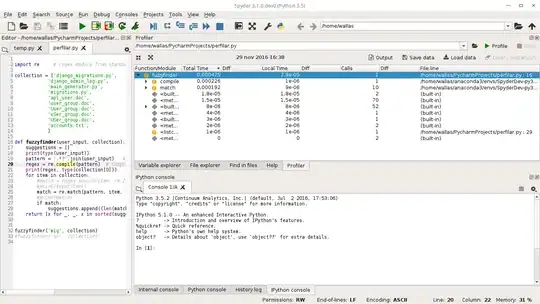
I'm using profiler in Spyder IDE to profile a simple program. One of the functions, make_geology is the piggiest part of the code. It appears to use 24.7 time units (are they seconds?). But when I look at all the calls made from within make_geology (everything I've highlighted in yellow), that sum of time only adds up to 1.3 time units.

Am I misundertanding the measurement and allocation of time spent in functions? I would have thought time spent in make_geology = sum of time spent on all the things inside make_geology

user3556757
  • 3,469
  • 4
  • 30
  • 70
  • Have you tried [*this method*](http://stackoverflow.com/a/4299378/23771)? For one thing, it is sensitive to percents, not absolute measurements, so it directly tells you what's piggy. It also tells you why. – Mike Dunlavey Dec 05 '16 at 18:09

2 Answers2

1

I have provided this PR to solve this trouble.

At the beginning the profiler looks like this: profiler_before

The final result looks like this: spyder 3 1 0 dev0 python 3 5 _001

Any suggestions or corrections are welcome.

Best Regards

William Trigos

William Trigos
  • 360
  • 1
  • 10
0

It would seem that make_geology has some functionality that is done inside the function call itself, not "offloaded" to other components (functions). Imagine something like this:

def add_and_count(mylist, mynumber):
  i = 0
  while i < mynumber:
      i = i + 1
  mylist.append(i)

If mynumber is 0, the time to execute add_and_count should be about the same as the time to execute list's append call. If mynumber is huge, the list.append would be a drop in the bucket

Calin Ceteras
  • 206
  • 1
  • 4