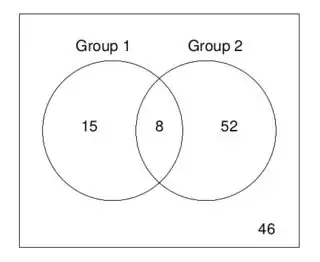
I want to have a venn diagram of the differences in two matrices p.mat.p and p.mat.t which have same dimensions when alpha set.
Pseudocode
- add item to the intersection if matches between two matrices; it can be match FALSE or TRUE; else leave the item outside the intersection like normally with Venn diagrams
- Put IDs of matrix cells on the Venn diagram
Two approaches: matrix with vennDiagram and venn with lists.
Data
p.mat.p
           1     2     3     4     5     6     7     8     9    10    11
    1   TRUE  TRUE  TRUE FALSE FALSE  TRUE FALSE FALSE FALSE FALSE FALSE
    2   TRUE  TRUE  TRUE FALSE FALSE FALSE FALSE FALSE FALSE FALSE FALSE
    3   TRUE  TRUE  TRUE FALSE FALSE  TRUE FALSE FALSE FALSE FALSE FALSE
    4  FALSE FALSE FALSE  TRUE FALSE FALSE FALSE  TRUE FALSE FALSE FALSE
    5  FALSE FALSE FALSE FALSE  TRUE FALSE FALSE FALSE FALSE FALSE FALSE
    6   TRUE FALSE  TRUE FALSE FALSE  TRUE FALSE FALSE FALSE FALSE FALSE
    7  FALSE FALSE FALSE FALSE FALSE FALSE  TRUE FALSE FALSE FALSE FALSE
    8  FALSE FALSE FALSE  TRUE FALSE FALSE FALSE  TRUE FALSE FALSE FALSE
    9  FALSE FALSE FALSE FALSE FALSE FALSE FALSE FALSE  TRUE FALSE FALSE
    10 FALSE FALSE FALSE FALSE FALSE FALSE FALSE FALSE FALSE  TRUE FALSE
    11 FALSE FALSE FALSE FALSE FALSE FALSE FALSE FALSE FALSE FALSE  TRUE

p.mat.t
           1     2     3     4     5     6     7     8     9    10    11
    1  FALSE  TRUE  TRUE  TRUE FALSE  TRUE FALSE FALSE FALSE FALSE  TRUE
    2   TRUE FALSE FALSE FALSE  TRUE FALSE  TRUE  TRUE  TRUE  TRUE FALSE
    3   TRUE FALSE FALSE FALSE  TRUE FALSE  TRUE  TRUE  TRUE  TRUE FALSE
    4   TRUE FALSE FALSE FALSE  TRUE FALSE  TRUE  TRUE  TRUE  TRUE FALSE
    5  FALSE  TRUE  TRUE  TRUE FALSE  TRUE FALSE FALSE FALSE FALSE  TRUE
    6   TRUE FALSE FALSE FALSE  TRUE FALSE  TRUE  TRUE  TRUE  TRUE FALSE
    7  FALSE  TRUE  TRUE  TRUE FALSE  TRUE FALSE FALSE FALSE FALSE  TRUE
    8  FALSE  TRUE  TRUE  TRUE FALSE  TRUE FALSE FALSE FALSE FALSE  TRUE
    9  FALSE  TRUE  TRUE  TRUE FALSE  TRUE FALSE FALSE FALSE FALSE  TRUE
    10 FALSE  TRUE  TRUE  TRUE FALSE  TRUE FALSE FALSE FALSE FALSE  TRUE
    11  TRUE FALSE FALSE FALSE  TRUE FALSE  TRUE  TRUE  TRUE  TRUE FALSE
Code with matrices
library("psych")
library("gplots")
library("limma") # http://www.ats.ucla.edu/stat/r/faq/venn.htm

ids <- seq(1,11)
M.cor <- cor(mtcars)
colnames(M.cor) <- ids
rownames(M.cor) <- ids
p.mat <- psych::corr.test(M.cor, adjust = "none", ci = F)

alpha <- .00000005

p.mat.p <- (p.mat[["p"]] < alpha)
str(p.mat.p)
print(p.mat.p)

p.mat.t <- (p.mat[["t"]] < alpha)
str(p.mat.t)
print(p.mat.t)

# http://www.ats.ucla.edu/stat/r/faq/venn.htm
c3 <- cbind( c(p.mat.p), c(p.mat.t))
a <- vennCounts(c3)
vennDiagram(a)
Output without IDs on circles and its intersection so not sufficient
Expected output: venn diagram with IDs on intersection, circles and elsewhere.
With lists
I think working with lists is mandatory here because venn supports only them
library("corrplot")
library("psych")

ids <- seq(1,11)
M.cor <- cor(mtcars)
colnames(M.cor) <- ids
rownames(M.cor) <- ids
p.mat <- psych::corr.test(M.cor, adjust = "none", ci = F)

alpha <- .00000005

# http://stackoverflow.com/q/2471188/54964
p.mat.p <- (p.mat[["p"]] < alpha)
p.mat.p <- as.list(p.mat.p)

p.mat.t <- (p.mat[["t"]] < alpha)
p.mat.t <- as.list(p.mat.t)

venn(list(first.vector = p.mat.p, second.vector = p.mat.t))
Output: 121 in the intersection so wrong
R: 3.3.1
OS: Debian 8.5
