0

this MATLAB code plot multivariate normal distribution pdf for a matrix with 2 vector. But I have a 3 vector matrix. how can I modify this code for my 3 vector matrix to draw shape like given bellow? let the 3rd vector be X3

Sigma = [.25 .3; .3 1];
x1 = -3:.2:3; x2 = -3:.2:3;
[X1,X2] = meshgrid(x1,x2);
F = mvnpdf([X1(:) X2(:)],mu,Sigma);
F = reshape(F,length(x2),length(x1));
surf(x1,x2,F);
caxis([min(F(:))-.5*range(F(:)),max(F(:))]);
axis([-3 3 -3 3 0 .4])
xlabel('x1'); ylabel('x2'); zlabel('Probability Density');
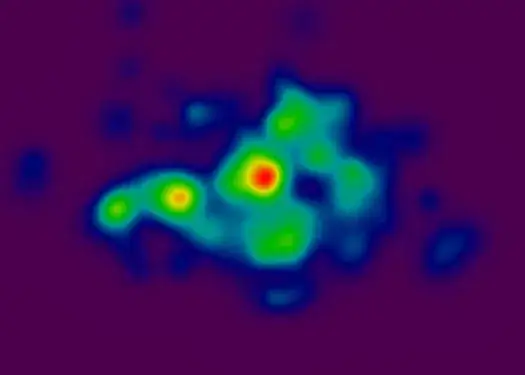
It is the resulting imageenter image description here

  • you'll need to use some volumetric representation of data. – Ander Biguri Nov 20 '16 at 13:38
  • I am using MATLAB for anomaly detection in which I have data with 3 features. so would you still suggest volumetric representation of data? I am new to Matlab and anomaly detection, its just the start – Waseem Adil Nov 20 '16 at 13:48
  • 1
    None of that information is relevant. If you have a a value `v` for each `x,y,z` then you need volumetric representation. – Ander Biguri Nov 20 '16 at 14:10
  • Possible duplicate of [Plotting volumetric data in MATLAB](http://stackoverflow.com/questions/27659632/plotting-volumetric-data-in-matlab) – Ander Biguri Nov 20 '16 at 14:10

0 Answers0