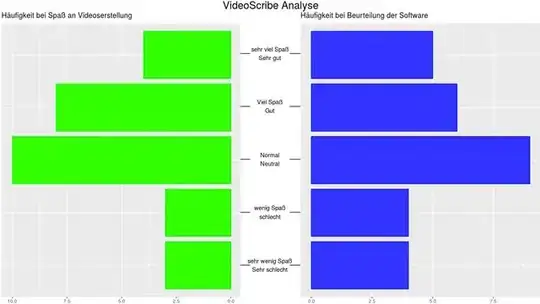
I have a question to the following plot I generated. There are two barplots with the same y axis, generated with the ggplot2 command. My problem is, that I want to write the labels of the y axis in two lines for each label. And also the labels are not numbers nor dates, they are characters (I think they are called like this).
At first, here is the original dataset:
VS <- data.frame(X = c("sehr viel Spaß/Sehr gut", "Viel Spaß/Gut", "Normal/Neutral","wenig Spaß/schlecht",
                       "sehr wenig Spaß/Sehr schlecht"),
                 Spaß = c(4,8,10,3,3), Beurteilung = c(5,6,9,4,4), stringsAsFactors = F)
To generate the plot I created the following command, out of:
VS$X <- factor(VS$X, c("sehr wenig Spaß/Sehr schlecht", "wenig Spaß/schlecht", "Normal/Neutral", "Viel Spaß/Gut", "sehr viel Spaß/Sehr gut"))


library(ggplot2)
library(grid)

g.mid<-ggplot(VS,aes(x=1,y=X))+geom_text(aes(label=X))+
  geom_segment(aes(x=0.94,xend=0.96,yend=X))+
  geom_segment(aes(x=1.04,xend=1.065,yend=X))+
  ggtitle("")+
  ylab(NULL)+
  scale_x_continuous(expand=c(0,0),limits=c(0.94,1.065))+
  theme(axis.title=element_blank(),
        panel.grid=element_blank(),
        axis.text.y=element_blank(),
        axis.ticks.y=element_blank(),
        panel.background=element_blank(),
        axis.text.x=element_text(color=NA),
        axis.ticks.x=element_line(color=NA),
        plot.margin = unit(c(1,-1,1,-1), "mm"))

g1 <- ggplot(data = VS, aes(x = X, y = Spaß)) +
  geom_bar(stat = "identity", fill="#33FF00", colour="green") + ggtitle("Häufigkeit bei Spaß an Videoserstellung") +
theme(axis.title.x = element_blank(),
        axis.title.y = element_blank(),
        axis.text.y = element_blank(),
        axis.ticks.y = element_blank(),
        plot.margin = unit(c(1,-1,1,0), "mm")) +
  scale_y_reverse() + coord_flip()

g2 <- ggplot(data = VS, aes(x = X, y = Beurteilung)) +xlab(NULL)+
  geom_bar(stat = "identity", fill="#3333FF", colour="blue") + ggtitle("Häufigkeit bei Beurteilung der Software") +
  theme(axis.title.x = element_blank(), axis.title.y = element_blank(),
        axis.text.y = element_blank(), axis.ticks.y = element_blank(),
        plot.margin = unit(c(1,0,1,-1), "mm")) +
  coord_flip()


library(gridExtra)
gg1 <- ggplot_gtable(ggplot_build(g1))
gg2 <- ggplot_gtable(ggplot_build(g2))
gg.mid <- ggplot_gtable(ggplot_build(g.mid))

grid.arrange(gg1,gg.mid,gg2, ncol=3, widths=c(4/9,1/9,4/9),top=textGrob("VideoScribe Analyse", gp=gpar(fontsize=19,font=8)))
The generated plot looks like follows: enter image description here
Like you maybe see, the labels of the y axis are cut by the graph... And anyway they are a bit long. But for my exam, I can't shorten them. So I tried to write each label in two lines with the command \n , but it didn't work. To be specific: I want to make out of "Sehr viel Spaß/Sehr gut" that there is written "Sehr viel Spaß" and directly underneath "Sehr gut". Can anybody give me a hint or help me, how I can do this?
I also tried some other things like gsub, but there is the problem, that I don't have a consistency or repeating parts inside the labels. Can somebody help?
PS: To get the y axis into this order, I created a static command - like you have probably seen. I also tried the following command: VS$X <- factor(VS$X, as.character(VS$X)) , but with this I get the y axis in the wrong order. It should just be turned around, that "Sehr viel Spaß/Sehr gut" is at the top. Has somebody maybe also an idea to this?
