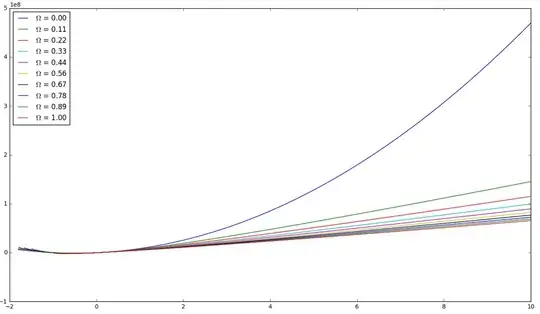
I know there are some similar questions around here but none of them seems to really get to my problem.
My code looks like this:
import numpy

import matplotlib.pyplot as plt

from scipy import integrate as integrate

def H(z , omega_m , H_0 = 70):

    omega_lambda=1-omega_m
    z_prime=((1+z)**3)
    wurzel=numpy.sqrt(omega_m*z_prime + omega_lambda)

    return H_0*wurzel


def H_inv(z, omega_m , H_0=70):

    return 1/(H(z, omega_m, H_0=70))

def integral(z, omega_m , H_0=70):

    I=integrate.quad(H_inv,0,z,args=(omega_m,))
    return I


def d_L(z, omega_m , H_0=70):

    distance=(2.99*(10**8))*(1+z)*integral(z, omega_m, H_0=70)

    return distance
The functions do work, my problem: How can I plot d_L versus z ? Like it's obviously a problem that I have this integral function in the definition of my d_L and it depends on z and some args=(omega_m, ).

