0

I am trying to execute a query using postgre sql driver for java jdbc.

I have an issue with memory buildup my statement is in a loop and then sleeps.

The problem is when I look at the job in task manager I can see the memory climbing 00,004K at a time. I have read the documentation I have closed all connections statements resultsets but this still happens.

Please could you tell me what is causing this in my code.

String sSqlString =  new String("SELECT * FROM stk.comms_data_sent_recv " +
                "WHERE msgtype ='RECEIVE' AND msgstat ='UNPRC' " +
                "ORDER BY p6_id,msgoccid " +
                "ASC; ");

        ResultSet rs = null;


        Class.forName("org.postgresql.Driver");

        Connection connection = DriverManager.getConnection(
                "jdbc:postgresql://p6tstc01:5432/DEVC_StockList?autoCloseUnclosedStatements=true&logUnclosedConnections=true&preparedStatementCacheQueries=0&ApplicationName=P6Shunter", "P6dev",
                "admin123");

        //Main Loop 
        while(true)
        {


            try{    

                Statement statement = connection.createStatement();
                statement.executeQuery(sSqlString);
                //rs.close();   
                statement.close();  

                //connection.close();
                rs = null;
                //connection = null;
                statement =null;
            } 
            finally {
            //connection.close();
            }


            try {
                Thread.sleep(loopTime);
            } catch (InterruptedException e) {
                // TODO Auto-generated catch block
                e.printStackTrace();
            }

        }


    }

Notice the commented out code.. I did close all but that did not seem to make a difference. Whet I did see is that it seems that the statement executeQuery(sSqlString); is causing this the reason I think so is if I remove the statement there is no memory leak.

I could be wrong but please assist me.

UPDATE:

I have changed my code as with your recommendations. Hope its a bit better please let me know if I need to change something.

My main loop :

public static  void main(String[] args) throws Exception {
    // TODO Auto-generated method stub


        //Main Loop 
        while(true)
        {

            getAndProcessAllUnprcMessagesFromStockList();

            try {
                Thread.sleep(loopTime);
            } catch (InterruptedException e) {
                // TODO Auto-generated catch block
                e.printStackTrace();
            }

        }


}

My Function it will call do fetch data :

public static void getAndProcessAllUnprcMessagesFromStockList() throws Exception
{

    ResultSet rs = null;
    Statement statement = null;
    Connection connection =null;

    String sSqlString =  new String("SELECT * FROM stk.comms_data_sent_recv " +
                        "WHERE msgtype ='RECEIVE' AND msgstat ='UNPRC' " +
                        "ORDER BY p6_id,msgoccid " +
                        "ASC; ");


    try{
        Class.forName("org.postgresql.Driver");

         connection = DriverManager.getConnection(
                "jdbc:postgresql://p6tstc01:5432/DEVC_StockList?autoCloseUnclosedStatements=true&logUnclosedConnections=true&preparedStatementCacheQueries=0&ApplicationName=P6Shunter", "P6dev",
                "admin123");

         PreparedStatement s = connection.prepareStatement(sSqlString,
                    ResultSet.TYPE_SCROLL_INSENSITIVE,
                    ResultSet.CONCUR_READ_ONLY);

         rs = s.executeQuery();


         while (rs.next()) {

                //Process records
                UnprcMsg msg = new UnprcMsg();


                msg.setP6Id(rs.getString(1));
                msg.setMsgOccId(rs.getString(2));
                msg.setWsc(rs.getString(3));
                msg.setMsgId(rs.getString(4));
                msg.setMsgType(rs.getString(5));
                msg.setMsgStatus(rs.getString(6));


                //JOptionPane.showMessageDialog(null,msg.getP6Id(), "InfoBox: " + "StockListShunter", JOptionPane.INFORMATION_MESSAGE);
                //msg2 = null;

            }


         rs.close();

         s.close(); 
    }
    catch(Exception e)
    {
        e.printStackTrace();
    }
    finally
    {
        connection.close();
    }


}

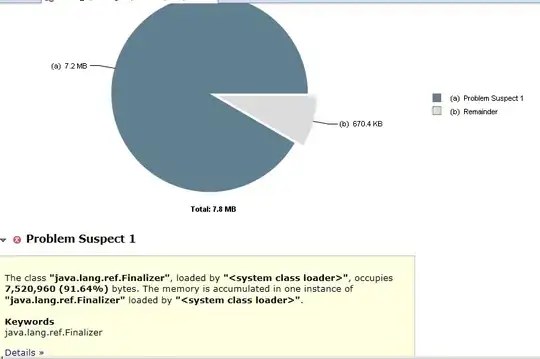
I have closed my connections statements and results. I also downloaded eclipse memory analyzer and I ran the jar witch will execute my main loop. Ran it for about an hour and here's some of the data I got from memory analyzer..

Leak suspects :

enter image description here

enter image description here

enter image description here

Now I know I cant go on the memory usage of task manager but whats the difference? Why does task manager show the following :

enter image description here

I was concerned about the memory usage I see in task manager? should I be?
Renier
  • 1,738
  • 3
  • 24
  • 51
  • 1
    Maybe you could generate a heap dump : http://stackoverflow.com/questions/407612/how-to-get-a-thread-and-heap-dump-of-a-java-process-on-windows-thats-not-runnin , and analyze its content with a tool like e.g Eclipse MAT : http://www.eclipse.org/mat/ – Arnaud Dec 15 '16 at 14:22
  • So you're getting an `OutOfMemoryError` with this code? – Kayaman Dec 15 '16 at 14:26
  • 1
    It is a good idea to close your resources using a try with resources block, or in a finally block. This includes your Statement and ResultSet objects. –  Dec 15 '16 at 14:28
  • No not getting any exception the code is working correctly but this process is eventually going to get to that exception... the program is going to pole a table for changes so it will be running all the time, the problem for me is I noticed that for some reason the memory keeps on climbing. – Renier Dec 15 '16 at 14:28
  • 2
    No, you're assuming that it will run out of memory. The Task Manager is not the tool you use to see if there's a memory leak or not. Based on the code you're quite new to Java (or at least JDBC), so better not be too paranoid about memory leaks. If you get an `OOME`, then you might have a memory leak. There's nothing indicating one in this code. – Kayaman Dec 15 '16 at 14:30
  • Also keep in mind that setting an Object to null does not guarantee it is immediately cleaned up. –  Dec 15 '16 at 14:31
  • Thanks I will get a memory dumb and analyze it. I started to set then to null an waited to see when the garbage collector would clear them but could not see the usage going down.. I know you said I cant use task manager to check memory leaks but I assumed that my process that started at about 10 000K and when I left it to run it went to 50 000K and still increased. – Renier Dec 15 '16 at 14:39
  • Then you should be able to test easily if it will throw an `OOME`, give the process some `100M` of heap and see what happens after a while. Is that the full code you're showing? – Kayaman Dec 15 '16 at 14:42
  • The Postgres JDBC driver will buffer the **complete** result in memory (before `executeQuery()` returns). You can turn that off by using a cursor. See the manual for details: https://jdbc.postgresql.org/documentation/head/query.html#query-with-cursor –  Dec 15 '16 at 15:30
  • The real question is: what is that code supposed to do? You are not even processing the result of `executeQuery()` –  Dec 15 '16 at 15:31
  • Even if you don't use it statement.executeQuery(sSqlString) returns an Resultset and you don't close it try rs=statement.executeQuery(sSqlString); rs.close(); – Rémy Baron Dec 15 '16 at 16:11
  • 1
    @RémyBaron Closing the statement will close any associated resultsets (in any half-decent driver, and Postgres has a good one), although it's still a good idea to close them explicitly. – Kayaman Dec 16 '16 at 07:19
  • I have updated my code as well as memory analyzer data. Please let me know if you need more info. I did close the connection and statements. My concern is the memory usage in task manager vs what I see now in memory analyzer.. Whats the difference. And should I worry about the process memory witch is about 126,144K now? and climbing.. – Renier Dec 19 '16 at 08:37
  • 1
    Once the JVM has allocated memory it will **not** return it to the operating system. So in the task manager you will **never** see the memory go down for a Java process. You should rather use something like JVisualVM to inspect the heap. And you only have a memory _leak_ if a garbage collection doesn't free those objects on the heap. Otherwise is simply memory consumption –  Dec 19 '16 at 08:39
  • What will be the reason for it to be incremented all the time? Does this mean that there's something wrong with my code witch is causing a memory leak or memory not releasing? – Renier Dec 19 '16 at 08:41
  • It seems to be stable now the memory usage in task manager stays about 125,276K ish so its like it settled , its just weird for me that the application uses that mutch memory. I think my problem is understanding the memory usage of java and when it will stop consuming memory. – Renier Dec 19 '16 at 09:02

0 Answers0