-1

for visualized my data, I used gplot. Question: Why "colour" doesn't change, and is it possible to do type = "h" like in basic plot?

print(qplot(roundpop, Observation, data=roundpopus), shape = 5, colour = "blue") # i tryed with "" and without.

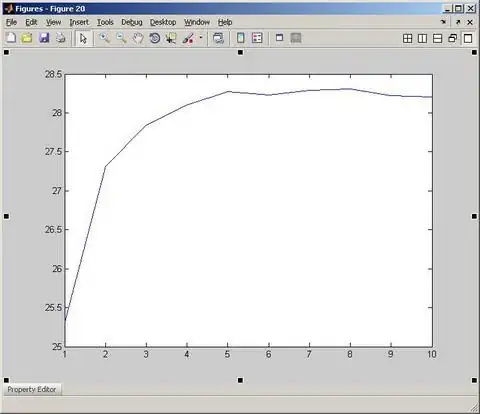
enter image description here

And if it's possible to change type to histogram, like on second picture, can I draw a line by the top of lines?

enter image description here

Like that: enter image description here

and maybe to write labels (states) on the top of the lines. Because I know how to give a name only for dots on basic plot.

Thank you!

Community
  • 1
  • 1
Pon4a
  • 27
  • 2
  • 9
  • 1
    Nadya, the question could be improved. You may want to read [how to provide minimal reproducible examples in R](http://stackoverflow.com/questions/5963269/how-to-make-a-great-r-reproducible-example#answer-5963610). A good post usually provides minimal input data, the desired output data & code tries - all copy-paste-run'able in a new/clean R session. This way, it's easier to get a grasp on the problem. – lukeA Dec 18 '16 at 14:21
  • Just in case, i found mistake in my code. print(qplot(roundpop, Observation, data=roundpopus), shape = 5, colour = "blue") shape can't be changed for continious varaible and colour should be inside brackets. print(qplot(roundpop, Observation, data=roundpopus,colour = "blue")) – Pon4a Dec 18 '16 at 19:11

1 Answers1

1

Here are some options, which you may want to tweak according to your needs:

library(ggplot2)
df <- structure(list(x = c(1, 2, 2, 2, 3, 3, 3, 3, 4, 4, 5, 5, 5, 6, 
6, 6, 7, 7, 7, 7, 8, 9, 10, 10, 10, 12, 13, 13, 20, 20, 27, 39
), y = c(33, 124, 45, 294, 160, 105, 276, 178, 377, 506, 176, 
393, 247, 378, 221, 796, 503, 162, 801, 486, 268, 575, 828, 493, 
252, 495, 836, 551, 413, 832, 1841, 1927), lab = c("i8g8Q", "oXlWk", 
"NC2WO", "pYxBL", "Xfsy6", "FJcOl", "Ke98f", "K2mCW", "g4XYi", 
"ICzWp", "7nqrK", "dzhlC", "JagAW", "0bObp", "8ljIW", "E8OZR", 
"6Tuxz", "3Grbq", "xqsld", "BvuJT", "JXi2N", "eSDYS", "OYVWN", 
"vyWzK", "6AKxk", "nCgPx", "8lHrq", "kWAGm", "E08Rd", "cmIYY", 
"btoUm", "k6Iek")), .Names = c("x", "y", "lab"), row.names = c(NA, 
-32L), class = "data.frame")
p <- ggplot(df, aes(x, y)) 
gridExtra::grid.arrange(
  p + geom_point(),
  p + geom_point() + geom_text(aes(label = lab), angle = 60, hjust = 0, size = 2),
  p + geom_segment(aes(xend=x, yend=0)),
  p + geom_segment(aes(xend=x, yend=0)) + geom_line(color = "red", size = 2) ,
  p + geom_segment(aes(xend=x, yend=0)) + geom_smooth(span = .4, se = FALSE, color = "red", size = 2)
)

enter image description here

lukeA
  • 53,097
  • 5
  • 97
  • 100