5

Please have a look at the following example

library(dplyr)
library(lubridate)
library(ggplot2)
data <- data_frame(time = c(ymd(20160201),
                            ymd(20160202),
                            ymd(20160203),
                            ymd(20160201),
                            ymd(20160202)),
                            value = c(1,1,1,2,2), 
                            group = c('A','A','B','B','B'))

events <- data_frame(time = c(ymd(20160201), 
                              ymd(20160202)),
                     text = c('who let the dogs out?',
                              'who? who? who?'))

ggplot(data, aes(x = time, y = value, group = group, color = group)) + 
  geom_line(size = 2 ) +
  geom_vline(data = events, aes(xintercept = as.numeric(time)))  

> data
# A tibble: 5 × 3
        time value group
      <date> <dbl> <chr>
1 2016-02-01     1     A
2 2016-02-02     1     A
3 2016-02-03     1     B
4 2016-02-01     2     B
5 2016-02-02     2     B

> events
# A tibble: 2 × 2
        time                  text
      <date>                 <chr>
1 2016-02-01 who let the dogs out?
2 2016-02-02        who? who? who?

I would like to get a line chart for the variable value for each group (A and B) and plot vertical lines every time there is an event in the events dataframe.

Using the ideas ggplot vertical line with date axis, How to get a vertical geom_vline to an x-axis of class date? and How to add legend for vertical lines in ggplot? I can easily do that:

ggplot(data, aes(x = time, y = value, group = group, color = group)) + 
  geom_line(size = 2 ) +
  geom_vline(data = events, aes(xintercept = as.numeric(time)))

enter image description here

The problem is that I would like to label each vertical line (each event) with the corresponding text, as in R ggplot2: Labelling a horizontal line on the y axis with a numeric value.

Unfortunately, doing the following does not work

ggplot(data, aes(x = time, y = value, group = group, color = group)) + 
  geom_line(size = 2 ) +
  geom_vline(data = events, aes(xintercept = as.numeric(time)))  +
  geom_text(data = events, aes(x = as.numeric(time), y = 0, label = text))

What is wrong here? any ideas? Thanks!

Community
  • 1
  • 1
ℕʘʘḆḽḘ
  • 18,566
  • 34
  • 128
  • 235

1 Answers1

10

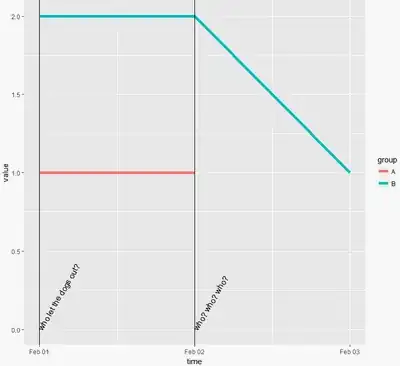
You can try

ggplot(data, aes(x = time)) + 
  geom_line(aes(y = value, group = group, color = group), size = 2 ) +
  geom_vline(data = events, aes(xintercept = as.numeric(time)))  +
  geom_text(data = events, mapping = aes(label = text, y = 0), angle = 60, hjust = 0)

enter image description here

lukeA
  • 53,097
  • 5
  • 97
  • 100
  • 3
    I like using `y = -Inf` for keeping `ylims` responsive. something like this `geom_text(data = events, aes(label = text, x = time, y = -Inf), angle = 90, inherit.aes = F, hjust = -.5, vjust = -.5)` – Nate Dec 19 '16 at 23:16
  • thanks guys. @NathanDay I find your solution very elegant as well. Do you mind explaining what your arguments do exactly here? why `y=inf`,what means `inherit.aes`? and `hjust` ? – ℕʘʘḆḽḘ Dec 20 '16 at 01:19
  • 1
    Yep, it is. `-inf` means minus infinity. This flexibly places the label at the bottom, no matter what the graphs' lower y limits are. (In contrast to `y=0`, which statically places it at `0`.) `inherit.aes=FALSE` makes `geom_text` forget about the global `aes(x = time)` from the 1st line. `hjust` and `vjust` do horizontal and vertical alignment. _"These can either be a number between 0 (right/bottom) and 1 (top/left) or a character ("left", "middle", "right", "bottom", "center", "top")."_ – lukeA Dec 20 '16 at 01:51
  • thanks @lukeA, can I ask you one more thing? why do you want inherit.aes=FALSE to make geom_text forget about the global aes(x = time) from the 1st line? I dont get it – ℕʘʘḆḽḘ Dec 20 '16 at 02:36
  • 3
    you need to forget about `group = group` since the variable `events$group` doesn't exist and `geom_text` is looking for it. you could set `group = NULL` instead. `geom_vline` doesn't look for it so it doesn't raise an error. – Nate Dec 20 '16 at 02:39
  • 1
    also with `Inf` and `-Inf` the default position is half-in/half-out of the viewport so you need the `h/v-just` dance to move it out to read/see – Nate Dec 20 '16 at 02:41
  • @NathanDay just a quick follow up. In my data the text can be very long, and in that case the text will not appear entirely but will be trimmed after its height reaches the top of the figure. how to fix that? – ℕʘʘḆḽḘ Dec 20 '16 at 13:58
  • 1
    maybe `expand_limits` `geom_blank` could help, they both do the same thing – Nate Dec 20 '16 at 14:09