7

I have the following undirected graph

gr={1->2,1->3,1->6,1->7,2->4,3->4,4->5,5->6,5->7};

which I wish to plot with GraphPlot in a 'diamond' format. I do this as outlined below (Method 1) giving the following:

alt text

The problem is that this representation is deceptive, as there is no edge between vertices 4 & 1, or 1 & 5 (the edge is from 4 to 5). I wish to change the route of edge {4,5} to get something like the following:

alt text

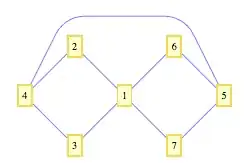
I do this by including another edge, {5,4}, and I can now use MultiedgeStyle to 'move' the offending edge, and I then get rid of the added edge by defining an EdgeRenderingFunction, thus not showing the offending line. (Method 2,'Workaround'). This is awkward, to say the least. Is there a better way? (This is my first question!)

Method 1

gr={1->2,1->3,1->6,1->7,2->4,3->4,4->5,5->6,5->7};

vcr={1-> {2,0},2-> {1,1},3-> {1,-1},4-> {0,0},5-> {4,0},6-> {3,1},7-> {3,-1}};

GraphPlot[gr,VertexLabeling-> True, 
             DirectedEdges-> False,
             VertexCoordinateRules-> vcr, 
             ImageSize-> 250]

Method 2 (workaround)

erf= (If[MemberQ[{{5,4}},#2], 
         { },      
         {Blue,Line[#1]}
        ]&);

gp[1] = 
       GraphPlot[
                 Join[{5->4},gr], 
                        VertexLabeling->True, 
                        DirectedEdges->False, 
                        VertexCoordinateRules->vcr, 
                        EdgeRenderingFunction->erf, 
                        MultiedgeStyle->.8, 
                        ImageSize->250
                        ]
Dr. belisarius
  • 60,527
  • 15
  • 115
  • 190
681234
  • 4,214
  • 2
  • 35
  • 42
  • @TomD I suggest changing "arrow direction" by "edge routing" in the title to get a more descriptive one. – Dr. belisarius Nov 10 '10 at 00:51
  • 1
    Thanks! That is a nice suggestion and I have edited accordingly. (I have also slightly modified the code for 'Method 2'. – 681234 Nov 10 '10 at 17:36
  • 1
    @TomD: the other workaround I devised was to use GraphPlot3D and to rotate the drawing until it looked 'pleasing'. But it didn't look like your twin-diamonds. – High Performance Mark Nov 10 '10 at 18:28
  • 1
    This one triggers a more difficult one: How to detect if one edge is getting routed through a vertex. This happens all the time, and in several occasions I tried to figure out what was wrong with a dynamically generated graph only to find out that it was an edge routing problem. – Dr. belisarius Nov 11 '10 at 12:18
  • @belisarius when this Q was first posted, I wrote the function `IntersectQ` (http://gist.github.com/673553) which could be passed to EdgeRenderingFunction to test for routing problems. But it was too slow to be used in a sensible solution to the original question. – Simon Nov 12 '10 at 01:05
  • @Simon Come on! Post it as a question to see if someone can improve it! – Dr. belisarius Nov 12 '10 at 01:41
  • @Simon Posted a direct calculation (non-minimizing) for the distance between point and segment here: http://stackoverflow.com/questions/849211/shortest-distance-between-a-point-and-a-line-segment/4165840#4165840 – Dr. belisarius Nov 12 '10 at 14:56
  • @belisarius Thanks. I had almost forgotten about that... – Simon Nov 12 '10 at 21:43

2 Answers2

2

Just a kickstart

The following detects if there is an edge that "touches" a vertex that is not one of its endpoints.

It works only for straight line edges right now.

The plan is using it as a first step and then creating a mock edge as in the method 2 posted in the question.

Uses another answer I posted here.

Clear["Global`*"];
gr = {1 -> 2, 1 -> 3, 1 -> 6, 1 -> 7, 2 -> 4, 3 -> 4, 4 -> 5, 5 -> 6, 5 -> 7};
vcr = {1 -> {2, 0}, 2 -> {1, 1}, 3 -> {1, -1}, 4 -> {0, 0}, 
       5 -> {4, 0}, 6 -> {3, 1}, 7 -> {3, -1}};
a = InputForm@GraphPlot[gr, VertexLabeling -> True, DirectedEdges -> False, 
                       VertexCoordinateRules -> vcr, ImageSize -> 250] ;

distance[segmentEndPoints_, pt_] := Module[{c, d, param, start, end},
   start = segmentEndPoints[[1]];
   end = segmentEndPoints[[2]];
   param = ((pt - start).(end - start))/Norm[end - start]^2;
   Which[
    param < 0, EuclideanDistance[start, pt],
    param > 1, EuclideanDistance[end, pt],
    True, EuclideanDistance[pt, start + param (end - start)]
    ]
   ];

edgesSeq= Flatten[Cases[a//FullForm, Line[x_] -> x, Infinity], 1];

vertex=Flatten[
          Cases[a//FullForm,Rule[VertexCoordinateRules, x_] -> x,Infinity]
               ,1];

Off[General::pspec];
edgesPos = Replace[edgesSeq, {i_, j_} -> {vertex[[i]], vertex[[j]]}, 1];
On[General::pspec];

numberOfVertexInEdge = 
  Count[#, 0, 2] & /@ 
   Table[ Chop@distance[segments, vertices], {segments, edgesPos}, 
                                             {vertices, vertex}
        ];

If[Length@Select[numberOfVertexInEdge, # > 2 &] >  0, 
            "There are Edges crossing a Vertex", 
            "Graph OK"]
Community
  • 1
  • 1
Dr. belisarius
  • 60,527
  • 15
  • 115
  • 190
  • I was trying to generalize this one, but there are too many pitfalls. Anyone knows if there are wire routing algorithms for Mathematica out there? – Dr. belisarius Nov 13 '10 at 17:59
1

Here's an even more awkward workaround:

Graphics[Annotation[GraphicsComplex[{{2., 0.}, {1., 1.}, 
          {1., -1.}, {3., 1.}, {3., -1.}, {0., 0.}, {4., 0.}, {0., 
     2.}, {4., 2.}}, 
        {{RGBColor[0.5, 0., 0.], Line[{{1, 2}, {1, 3}, {1, 4}, {1, 5}, 
                {2, 6}, {3, 6},  {7, 4}, {7, 5}, {6, 8}, {8, 9}, {9, 
        7}}]}, 
          {Text[Framed[1, {Background -> RGBColor[1, 1, 0.8], 
                  FrameStyle -> RGBColor[0.94, 0.85, 0.36], 
        FrameMargins -> 
                    Automatic}], 1], Text[Framed[2, 
                {Background -> RGBColor[1, 1, 0.8], FrameStyle -> 
                    RGBColor[0.94, 0.85, 0.36], 
        FrameMargins -> Automatic}], 2], 
            Text[Framed[3, {Background -> RGBColor[1, 1, 0.8], 
                  FrameStyle -> RGBColor[0.94, 0.85, 0.36], 
        FrameMargins -> 
                    Automatic}], 3], Text[Framed[6, 
                {Background -> RGBColor[1, 1, 0.8], FrameStyle -> 
                    RGBColor[0.94, 0.85, 0.36], 
        FrameMargins -> Automatic}], 4], 
            Text[Framed[7, {Background -> RGBColor[1, 1, 0.8], 
                  FrameStyle -> RGBColor[0.94, 0.85, 0.36], 
        FrameMargins -> 
                    Automatic}], 5], Text[Framed[4, 
                {Background -> RGBColor[1, 1, 0.8], FrameStyle -> 
                    RGBColor[0.94, 0.85, 0.36], 
        FrameMargins -> Automatic}], 6], 
            Text[Framed[5, {Background -> RGBColor[1, 1, 0.8], 
                  FrameStyle -> RGBColor[0.94, 0.85, 0.36], 
        FrameMargins -> 
                    Automatic}], 7]}}, {}], VertexCoordinateRules -> 
        {{2., 0.}, {1., 1.}, {1., -1.}, {3., 1.}, {3., -1.}, {0., 0.}, 
          {4., 0.}}], FrameTicks -> None, PlotRange -> All, 
    PlotRangePadding -> Scaled[0.1], AspectRatio -> Automatic, 
    ImageSize -> 250]

alt text

Of course, what I've done is taken the FullForm of the graphic of the graph and edited it. I added a couple of points to the GraphicsComplex (ie {0., 2.} and {4., 2.}), put some new legs into the line (ie {6, 8}, {8, 9}, {9, 7}) and deleted the leg which drew the line between vertices 4 and 5.

I don't really offer this as a 'solution' but someone with more time than I have to work on this should be able to write a function to manipulate the GraphicsComplex into a desired form.

High Performance Mark
  • 77,191
  • 7
  • 105
  • 161