40

I have two vectors representing the location of points (x,y) that I'd like to plot.

I know how to plot them, but I'd also like to label them 1, 2, 3, 4... with labels visible on the plot. The labels represent their order in the vector.

Franck Dernoncourt
  • 77,520
  • 72
  • 342
  • 501
Jamie Banks
  • 503
  • 1
  • 4
  • 6

1 Answers1

68

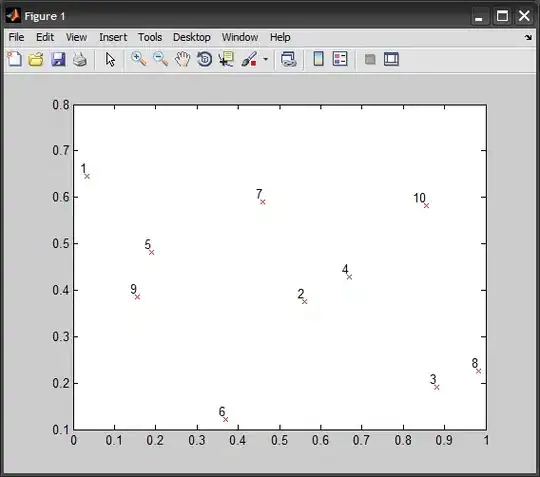
Here's one way to do this:

p = rand(10,2);
labels = cellstr( num2str([1:10]') );  %' # labels correspond to their order

plot(p(:,1), p(:,2), 'rx')
text(p(:,1), p(:,2), labels, 'VerticalAlignment','bottom', ...
                             'HorizontalAlignment','right')
alt text

Amro
  • 123,847
  • 25
  • 243
  • 454
  • 3
    I find it's useful to add `'Parent',axesHandle` as additional option to `text`, especially if you're plotting from within a function, to make sure the text actually appears on the right figure. – Jonas Nov 10 '10 at 01:41
  • Hello, How would you do that with "set" ? `h=text(p(:,1), p(:,2), labels); set(h,'Position',[p(:,1) p(:,2)],'String',labels);` It doesn't work. – k4lls May 22 '15 at 10:34
  • @k4lls: That's because `h` is an array of handle graphics (each "label" created is a separate `text` instance). Either you set each `h(i)` in a loop, or you use the special syntax: `set(h, {'Position'},num2cell(p,2), {'String'},labels)`. Learn more about it in the docs: http://www.mathworks.com/help/matlab/ref/set.html#f67-575595 – Amro May 22 '15 at 12:59