11

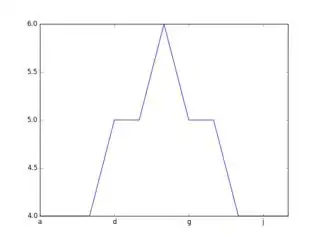
I am plotting data with strings as x labels. I'd like to control the label frequency to not overload the axis with text. In the example below i'd like to only see a label every 3 tick: a-d-g-j.

enter image description here

One way I could do that is to replace the my_xticks elements by 2 empty strings every n elements. But i'm sure it gives a cleaner way to do that.

Here is the code:

import numpy as np
import matplotlib.pyplot as plt

y=np.array([4,4,4,5,5,6,5,5,4,4,4])
x = np.arange(y.shape[0])
my_xticks=['a','b','c','d','e','f','g','h','i','j','k']

plt.xticks(x, my_xticks)
plt.plot(x, y)
Guillaume Jacquenot
  • 11,217
  • 6
  • 43
  • 49
michltm
  • 1,399
  • 2
  • 13
  • 33

1 Answers1

16

You're almost there! Sample the first and second arguments of xticks at the desired frequency!

The question is a duplicate from Changing the "tick frequency" on x or y axis in matplotlib?

import numpy as np
import matplotlib.pyplot as plt

y = np.array([4,4,4,5,5,6,5,5,4,4,4])
x = np.arange(y.shape[0])
my_xticks = np.array(['a','b','c','d','e','f','g','h','i','j','k'])
frequency = 3
plt.plot(x, y)
plt.xticks(x[::frequency], my_xticks[::frequency])

Plot

Community
  • 1
  • 1
rafaelvalle
  • 6,683
  • 3
  • 34
  • 36
  • Thx for answer. Instead of having to specify the targeted letters, i'd rather just give a period number so that the method can be used with a high numer of labels. I am currently trying to understand the duplicate post you mentioned. – michltm Jan 11 '17 at 19:38
  • well from my understanding it's not really a duplicate because in the post they use an array of numbers as ticks whereas I am dealing with strings. – michltm Jan 11 '17 at 19:50
  • I understand your question now. See the updated answer. – rafaelvalle Jan 11 '17 at 20:37
  • what if I want to tick on a particular alphabets? – weefwefwqg3 May 12 '18 at 19:45
  • change the variable my_xticks to the alphabet you want. – rafaelvalle May 14 '18 at 14:29