The problem is defining the xrange, it needs to be the same format timefmt (see ?time_axis)
The following works for me
set datafile separator ","
set xdata time
set timefmt "%d/%m/%Y %H:%M:%S"
set format x "%H:%M"
set autoscale y
set xrange["26/10/2010 13:00:00":"26/10/2010 14:00:00"]
plot './data.csv' using 1:2 with lines
Oh, and I got rid of the blank lines in between each line of data.
If you don't want to edit the file to get rid of the blank data, then you can use awk in gnuplot like so,
plot "<awk '$0!~/^$/ {print $0}' ./data.csv" using 1:2 with lines
for the final command.
EDIT: further info in case there is still a problem (see the comments)
I needed to use the awk command to get the data to plot. This was to remove the blank lines in the data. Combining awk and gnuplot in this fashion works on linux systems, I'm not certain about gnuplot on windows. It could be that certain piping isn't happening, in which case you would have to remove the blank lines before using gnuplot. (you could still use awk for this, but perhaps not in the plot command?)
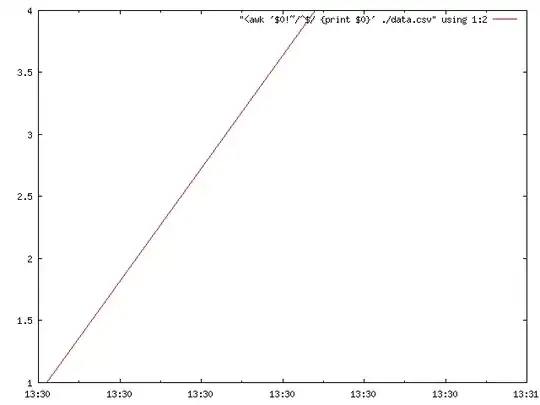
If you are using linux and the above is not working, then something else is the problem. Perhaps there are old commands stored in the gnuplot session? To make sure we are doing exactly the same thing, I give the shell script that I used (I changed the xrange to fit the data better and make a nicer plot, also notive the \$ instead of $, otherwise the shell misinterprets the $ sign).
Okay: I made the file data.csv.sh in a new folder (in case you have data.csv or data.csv.png files already),:
#!/bin/bash

echo "26/10/2010 13:30:01,1

26/10/2010 13:30:12,2

26/10/2010 13:30:23,3

26/10/2010 13:30:34,4" > "data.csv"


gnuplot<<EOF
set term png small
set output "data.csv.png"
set datafile separator ","
set xdata time
set timefmt "%d/%m/%Y %H:%M:%S"
set format x "%H:%M"
set autoscale y
set xrange["26/10/2010 13:30:00":"26/10/2010 13:31:00"]
plot "<awk '\$0!~/^\$/ {print \$0}' ./data.csv" using 1:2 with lines
set output
set term pop
EOF
Then on the terminal I typed:
chmod +wrx data.csv.sh && ./data.csv.sh
to make the shell script executable and then to run it.
The file data.csv.png looks like the following 
All the best
Tom
