0

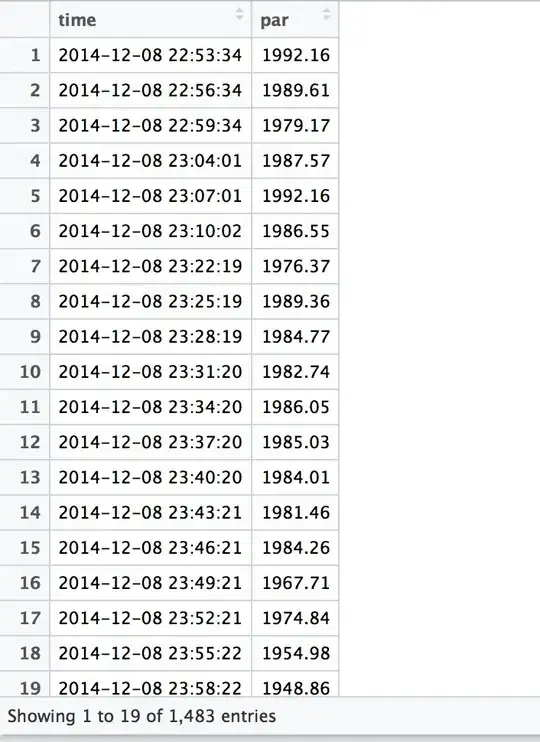
I have data frames consisting of two columns: light intensity (par), and time, with each row representing a 'snapshot' in time:

The data is effectively a time series. The image attached consists of 13 of the data frames: plot(df$time, df$par)

enter image description here

I have been trying to write a function that will return the data points representing dusk (first light of the day) and dawn (last light of the day).

On the graph, this would look like the first and last points on each of the "flat" areas of the graph, where the par (should) be equal to 0.

I've been able to identify most of them with an atrocious loop, that basically looks for streaks of min(par), and if it finds of >100 it saves the i-100th file:

dawnDusk <- function (df) {

  min.par <- min(df$par)
  day.streak <- 0
  night.streak <- 0
  dawn <- c()
  dusk <- c()

  for (i in 1:nrow(df)) {
    if (df$par[i] <= min.par + 0.1 | is.na(df$par[i])) {
      night.streak <- night.streak + 1
      day.streak <- 0
    } else if (df$par[i] > min.par + 0.1 | is.na(df$par[i])) {
      day.streak <-day.streak + 1
      night.streak <- 0
    }

    # the 100 comes from the shortest night in the year (~5hours)
    # divided into 3 minute intervals

    if (night.streak == 100) {
      dusk <- c(dusk, i - 100)
    } else if (day.streak == 100 & i != 100) {
      dawn <- c(dawn, i - 100)
    }
  }

I've also tried differencing it, but it came out funky...

The main issues that arise are that the instrument that measures par can be inaccurate (woohoo!), so the min can sometimes vary by +/- 0.1 from its baseline. It can also read 0 sometimes when it shouldn't (seen in the 7th graph)

One thing that might be helpful is once you can find 1 correct dawn and 1 correct dusk file, you know that every other file should be +/- 24 hours in time from it.

This is my first time posting on stackoverflow, I have spent hours looking at every post related to this topic to no avail. I'm hoping someone can help give me a push in the right direction. Thanks in advance!

dww
  • 30,425
  • 5
  • 68
  • 111
John M
  • 9
  • 1
  • 1
    Use `dput()` on your data so people can import it easily. It sounds like your question is more data related on not programming related. Stackoverflow is more for programming questions not "how should I handle this data" questions. YOu just need to know if its night or day so if it were me I would convert your data to a binary format. . You may find this function helpful `rleid()`. Its from the `data.table` package. – CCurtis Jan 30 '17 at 21:20
  • Thanks for the feedback and the help!! I'm currently looking into a way to cleanly export the data... the data consists of 1400ish rows so the dput() looks like a novel... I'm trying out rleid() as we speak, thanks for a new lead (leid?) ! – John M Jan 30 '17 at 21:42
  • You only really need to `dput` a subset - say one time series covering one 24 hr period – dww Jan 30 '17 at 21:44
  • 2
    How are you defining 'dusk' and 'dawn'? These are pretty loose concepts. If you know the location (latitude/longitude), then you can get precise sunrise & sunset times using `suncalc()` from the RAtmosphere package. – dww Jan 30 '17 at 21:47
  • @dww true, I'll upload that asap. As far as the definition, I am just using the first/last time par is registered in the instrument (theoretically, this should be right when there starts to be any amount of sunlight). I messed around with a package similar to `suncalc()` called `maptools()`. That package will also take in a latitude and longitude parameter (I have this data in another df), but there was so many issues with `as.POSIXct()` timezones that I gave up.. – John M Jan 30 '17 at 21:50
  • It seems that the minimum amount of data points to replicate the problem is ~500.. so I don't think I can provide the necessary data. My apologies, thanks for people that still helped out – John M Jan 30 '17 at 22:02
  • @JohnM read this http://stackoverflow.com/questions/5963269/how-to-make-a-great-r-reproducible-example . You should be able to approximate your data with a few lines of code if not one. – CCurtis Jan 30 '17 at 22:27
  • "One thing that might be helpful is once you can find 1 correct dawn and 1 correct dusk file, you know that every other file should be +/- 24 hours in time from it." Are you assuming dawn and dusk occur at the same time every day? – A. Webb Jan 30 '17 at 22:43
  • @A.Webb Yes in general since we are looking at a 3-7 day period, and not changing our lat/lon significantly, we can assume they should occur at the same time (it's going to vary by a few minutes but I'm not too concerned about that). – John M Jan 30 '17 at 22:58
  • Sunrise/set won't vary much. But dusk and dawn are entirely different, if you define them as the 1st/last measurements above detection limit on instrument. The rate at which sky brightens/fades each day depends on cloud cover and aerosol loading. We can even see this in ur data visually - some days the change is more abrupt than others. If you really want to use instrumnent detection limit as your definition, then you will need daily times for each location. If the only reason you dont want to go by sunrise/set is troubles dealing with time zones, then that may be an easier problem to solve – dww Jan 30 '17 at 23:17
  • In the case of having several days where you don't mind fudging the change in dawn/dusk, you might want to leverage some times series tools. Check out, e.g., `stl` to do "seasonal" decomposition where the period would be 24 hours, perhaps using robust=TRUE. You'll also want to check out the `zoo` library, which I believe can take a time series measured at irregular intervals and interpolate to regular intervals for analysis. – A. Webb Jan 30 '17 at 23:23

0 Answers0