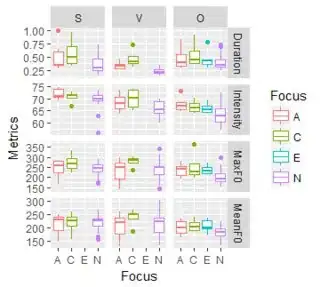
In the chart below, each separate facet is labeled, and there is a separate label on the left for the Y-axis. I'd like to make the label "Metrics" appear on top of the facet labels, as a single label joining all of the individual labels. I know about things like label_both but this does not address the issue.
Essentially, I would like something like this connecting each facet:

Code:
library(ggplot2)
library(tidyr)
library(dplyr)

df <- read.csv('Lab3.csv')
df$SVO <- factor(df$SVO,
                 levels=c("S","V","O"))
long.df <- df %>% gather(Metric, Value, Duration:Intensity)

ggplot(long.df, aes(x=Focus, y=Value)) +
  geom_boxplot(aes(color=Focus)) +
  facet_grid(Metric ~ SVO, scales='free_y') +
  labs(y="Metrics")
