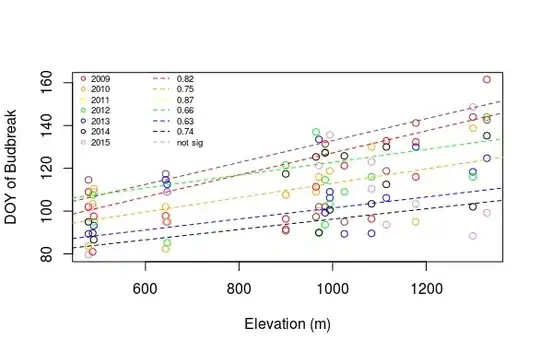
I am trying to have two separate legends for two data series. Basically I have a data series and regression lines, and I would like one legend with the regression data, preferably with the adjr2 reported, and another legend with the points from the dataset. I'm new to ggplot2, and I have not been able to figure out guides(guide_legend).
Here's my code. I've managed to get just the points to show on the legend, so I would like to create a second one for the dashed regression lines. I have a column for the adjusted r2 values, which I would like to call for the 2nd legend.
g <- ggplot(acci_bud, aes(x = Elevation, y = DOY, color = Year)) +
       geom_errorbar(aes(ymin = DOY -se, ymax = DOY +se), width = .1, show.legend = F)
g <- g + geom_point()
g <- g + geom_abline(data = acci_elev_slope, aes(slope = slope_coeff,
     intercept = slope_int, color = year),linetype = 'dashed', show.legend = F)
I can make this plot with the base package, but I would like to be able to have a basic script that I use for multiple datasets and I think ggplot2 is more conducive to this.
EDIT: this should be reproducible:
acci_bud <- data.frame(  Elevation = rep((seq(from = 500, to = 1250, by = 50)),7),
                   DOY = sample(75:180, 112, replace = TRUE),
                   Year = rep(2009:2015, each = 16),
                   se = 2)

acci_elev_slope <- data.frame ( year = seq(from = 2009, to = 2015, by = 1),
                   slope_coeff = c(0.05, 0.03, 0.051, 0.030, 0.025, 0.025, 0.034),
                   slope_int = c(75.76, 79.52, 81.80, 92.71, 75.76, 72.07, 90.6),
                   adjr2 = c(0.87, 0.79, 0.65, 0.89, 0.20, 0.57, 0.90))


acci_bud$Year <- as.factor(acci_bud$Year)
acci_elev_slope$year <- as.factor(acci_elev_slope$year)

g <- ggplot(acci_bud, aes(x = Elevation, y = DOY, color = Year)) +
       geom_errorbar(aes(ymin = DOY -se, ymax = DOY +se), width = 0.1, show.legend = F)
g <- g + geom_point()
g <- g + geom_abline(data = acci_elev_slope,
                     aes(slope = slope_coeff, intercept = slope_int, color = year),
                     linetype = 'dashed', show.legend = F)
g