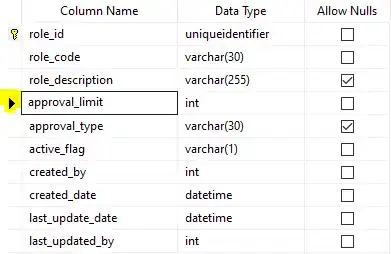
I have a list of participants with unique IDs (P1-35) in a clinical trial. Some were control (P15,P16,P29-P35) and some non-control (All the rest).
I have a data.frame with patient physiological responses such as SkinTemp and HeartRate. I've been plotting all the data but would like to subset it into Control vs Non-control to be able to look at it separately and plot it separately.
Is there a way of adding an extra column of Ns and Cs based on wthether they participant was control or non-control?
EDIT: New data
    dput(head(data.frame(lp2),10))
structure(list(id = structure(c(1L, 1L, 1L, 1L, 1L, 1L, 1L, 1L,
1L, 1L), .Label = c("1", "10", "11", "12", "13", "14", "15",
"16", "17", "18", "19", "2", "20", "21", "22", "23", "24", "25",
"26", "27", "28", "29", "3", "30", "31", "32", "33", "34", "4",
"5", "6", "7", "8", "9"), class = "factor"), Time = c(0, 0, 0,
0, 0, 0, 0, 0, 0, 0), SkinTemp = c(27.781, 27.78, 27.779, 27.779,
27.778, 27.777, 27.776, 27.775, 27.775, 27.774), HeartRate = c(70,
70, 70, 70, 70, 70, 70, 70, 70, 70), RespirationRate = c(10,
10, 10, 10, 10, 10, 10, 10, 10, 10), HeartRateZero = c(39.764,
39.764, 39.764, 39.764, 39.764, 39.764, 39.764, 39.764, 39.764,
39.764), HeartRateZeroNorm = c(0.273998277347115, 0.273998277347115,
0.273998277347115, 0.273998277347115, 0.273998277347115, 0.273998277347115,
0.273998277347115, 0.273998277347115, 0.273998277347115, 0.273998277347115
), RespirationRateZero = c(6.404, 6.404, 6.404, 6.404, 6.404,
6.404, 6.404, 6.404, 6.404, 6.404), RespirationRateZeroNorm = c(0.158766362554542,
0.158766362554542, 0.158766362554542, 0.158766362554542, 0.158766362554542,
0.158766362554542, 0.158766362554542, 0.158766362554542, 0.158766362554542,
0.158766362554542), SkinTempZero = c(0.43, 0.429000000000002,
0.428000000000001, 0.428000000000001, 0.427, 0.426000000000002,
0.425000000000001, 0.423999999999999, 0.423999999999999, 0.423000000000002
), SkinTempZeroNorm = c(0.0600307133882451, 0.0598911070780402,
0.0597515007678348, 0.0597515007678348, 0.0596118944576294, 0.0594722881474245,
0.0593326818372191, 0.0591930755270137, 0.0591930755270137, 0.0590534692168088
), TimeZero = c(0, 0, 0, 0, 0, 0, 0, 0, 0, 0), TimeZeroNorm = c(0,
0, 0, 0, 0, 0, 0, 0, 0, 0), Segment = c(1L, 1L, 1L, 1L, 1L, 1L,
1L, 1L, 1L, 1L), TimeLower = c(-Inf, -Inf, -Inf, -Inf, -Inf,
-Inf, -Inf, -Inf, -Inf, -Inf), TimeUpper = c(0, 0, 0, 0, 0, 0,
0, 0, 0, 0)), .Names = c("id", "Time", "SkinTemp", "HeartRate",
"RespirationRate", "HeartRateZero", "HeartRateZeroNorm", "RespirationRateZero",
"RespirationRateZeroNorm", "SkinTempZero", "SkinTempZeroNorm",
"TimeZero", "TimeZeroNorm", "Segment", "TimeLower", "TimeUpper"
), row.names = c(NA, 10L), class = "data.frame")
