I am trying to make the following image in R using geom_raster and geom_line (I made this using each of these separately and photo-shopping the line on top).
x is time (days here), y is depth (m), colour is temperature (C)
The background colour is the average temperature for each ten meter depth bin and does not change with x. The line is a reading of depth recorded every two minutes.
Is there a way I can do this in ggplot?
My data-frame structure and code to get these plots was simply:
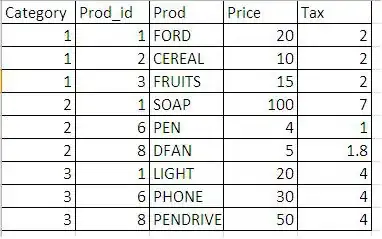
 Unique.days depthbins temperature Unique.point  ActualDepth
  119         5        29.34            1        61.9
  119         15       29.10            2        52.8
  119         25       28.90            3        53.8
  119         35       28.45            4        52.8
  119         45       27.23            5        60.2
  119         185      21.57            19       10
  119         195      21.38            20       15.1
  119         5        29.34            21       20.1
  119         15       29.1             22       15.2
The temperature is the average for each depth bin, and these rows repeat every 20 rows for the entirety of the dataset. ActualDepth is a trace that differs throughout the dataset.
(1) For the raster
CODE:
ggplot(data = test1, aes(x = Unique.days, y = depthbins)) +
  geom_raster(aes(fill = temperature), interpolate = TRUE) +
  scale_y_reverse()
(2) For the geom_line
CODE:
ggplot(data = test1, aes(x = Unique.point, y = ActualDepth)) +
  geom_line(data = test1, aes(x = Unique.point, y = ActualDepth)) +
  scale_y_reverse() +
  theme_bw()
When I've tried putting them together I can't get the scale right. e.g.
ggplot(data = test1, aes(x = Unique.days, y = DepthBins)) +
  geom_raster(aes(fill = temperature), interpolate = TRUE) +
  scale_y_reverse() +
  geom_line(data = test1,
            aes(x = Unique.days, y = ActualDepth),
            col = 'white')
results in:

Colours don't matter so much for now, but I want the change in depth to be obvious.
Any help would be greatly appreciated!