4

I am trying to develop a multi-process system with RaspberryPi in which I want to monitor all major processes and how they are scheduled using Linux. That is, obtaining scheduler states, start time, release time etc. I have been messing with '/proc' folder in order to find such an information but I haven't able to find anything really useful so far.

For example, if you go into /proc/pid/task/pid you can see:

se.exec_start
se.vruntime
se.sum_exec_runtime
se.statistics.wait_start
se.statistics.sleep_start
se.statistics.block_start
se.statistics.sleep_max
se.statistics.block_max
se.statistics.iowait_sum
se.statistics.wakeups

and so on. Now, this looks like I am up to something, but not clear enough. I want to just see how processes are scheduled in cores. i.e, Process1 released at 0.30, then Process2 started at 0.70 (system timer values) etc.

Is something like this possible by monitoring kernel folders such as '/proc'? If not, is there a way to determine this using another tracing tools or scheduler tools for Linux?

Any guidance is greately appreciated. Please tell me if there is something else I need to provide.

Thanks in advance.

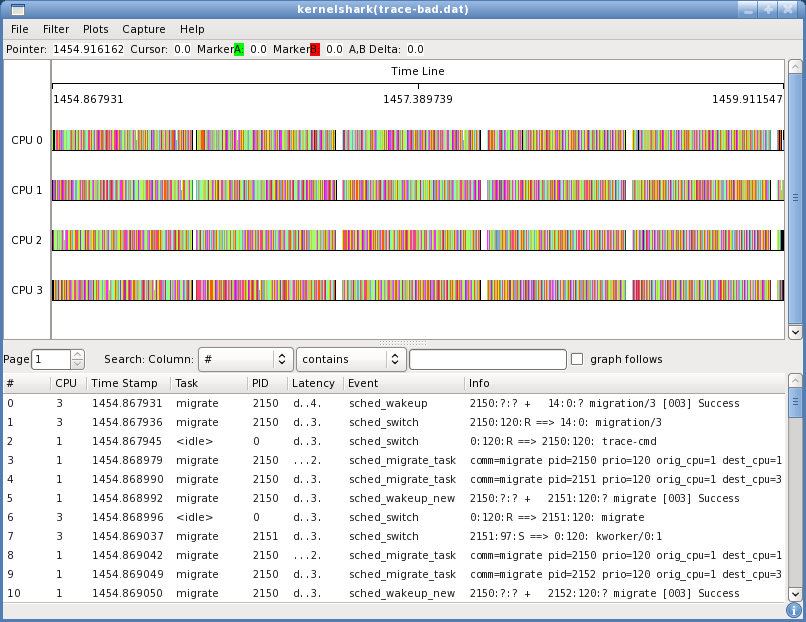
EDIT: using kernelshark, enter image description here

I want to find out exactly, for other processes too, when does cpu complete one iteration for every task.

mozcelikors
  • 2,582
  • 8
  • 43
  • 77

1 Answers1

5

I want to just see how processes are scheduled in cores. i.e, Process1 released at 0.30, then Process2 started at 0.70 (system timer values) etc.

This is called tracing, and usually done in the kernel after request from user. There are several kernel event tracers in Linux. Try

Gregg has some info of Linux tracing (with "pony-corn mascot" magic): http://www.brendangregg.com/blog/2015-07-08/choosing-a-linux-tracer.html (there should be some presentation about tracing in https://www.slideshare.net/brendangregg)...

Is something like this possible by monitoring kernel folders such as '/proc'

There is no inotify for /proc (it has no real directories or real files inside: https://stackoverflow.com/a/24898733), so you can't monitor for changes, you can only reread some /proc (or some /sys) periodically.

Community
  • 1
  • 1
osgx
  • 90,338
  • 53
  • 357
  • 513
  • hmm sorry for the delay to reply. I will try these today and let you know. – mozcelikors Mar 07 '17 at 12:30
  • @mozcelikors, do you want to monitor the scheduling from your application automatically, or you need some tools to investigate scheduling in manual mode for several times? – osgx Mar 07 '17 at 13:18
  • Investigation works for me. Your suggestion with perf sched seems like what I would want exactly. Let me ask about my concern: seeing perf sched map really helps visualizing details, but can I get release, start and end times for these processes (in parallel computing terminology) Also, do I need to investigate several times? I would like to assume one ivestigation should give me idea of processes. – mozcelikors Mar 07 '17 at 13:25
  • Try `perf sched script` to get full dump of tracing events. You can parse it. Also, `trace-cmd record -e sched` + `kernelshark` and `lttng` + lttng Eclipse plugin (TraceCompass) will give you GUI and list of events (kernelshark is simple GUI; TraceCompass is very advanced GUI with arrows between events). – osgx Mar 07 '17 at 13:28
  • It was extremely helpful. Thanks for your kind suggestions. To be honest, some people said that it was impossible to derive this info. But I knew there had to be countless kernel tracers to make this possible. I will search methods to derive what I need from what I got. – mozcelikors Mar 07 '17 at 13:57
  • Hello again, do you think it is possible to obtain at which spesific point an event restarts? Thus, processes of my application has usually a routine placed in a while(True) block. I want to determine at which time they reach endpoint of that block and then start over. I see from kernelshark that processes just sleep at the end of their 'one iteration execution's. But I also see that not every task sleep means that its the end of its 'one iteration execution'. Adding a photo to the post. – mozcelikors Mar 08 '17 at 14:30
  • You need to define some kind of tracepoint inside your program's code to see this on timeline. There are uprobes (https://lwn.net/Articles/499190/ http://www.brendangregg.com/blog/2015-06-28/linux-ftrace-uprobe.html) in perf/ftrace/trace-cmd and several variants of source-code modifications in lttng - check lttng-ust http://lttng.org/man/3/lttng-ust/v2.7/ https://suchakra.files.wordpress.com/2014/08/osfy_lttng_april_2014.pdf http://www.yonch.com/tech/lttng-tracepoint-file (or you can just do some exotic system call at the place and add it to the list of traced events and search for in in log) – osgx Mar 08 '17 at 16:06