a = RandomInteger[{1, 96}]
b = RandomInteger[{1, 97 - a}]
c = RandomInteger[{1, 98 - a - b}]
d = RandomInteger[{1, 99 - a - b - c}]
e = 100 - a - b - c - d
Samples:
{34,25,26,3,12,Sum =,100}

{90,5,1,1,3,Sum =,100}

{29,16,21,9,25,Sum =,100}

{4,13,71,10,2,Sum =,100}
The numbers are no equally distributed, of course.
Edit
Here is a more homogeneous distribution:
a = RandomInteger[{1, 20}];
b = RandomInteger[{1, 40 - a}];
c = RandomInteger[{1, 60 - a - b}];
d = RandomInteger[{1, 80 - a - b - c}];
e = 100 - a - b - c - d;
Output:
{5,33,2,8,52,Sum =,100}
{14,9,50,5,22,Sum =,100}
{3,23,12,34,28,Sum =,100}
{1,16,4,5,74,Sum =,100}
{6,28,6,9,51,Sum =,100}
{11,25,7,1,56,Sum =,100}
{4,34,12,18,32,Sum =,100}
{6,13,25,26,30,Sum =,100}
{8,27,14,5,46,Sum =,100}
{17,13,23,25,22,Sum =,100}
Here are the frequencies for the numbers:

Edit
Perhaps a better one:
a = Max[#, 1] & /@ Evaluate[RandomInteger[{1, 20}, 5] - 1];
b = 100 - Total@a;
c = Mod[b, 5];
d = (b - c)/ 5;
a = a + d + {c, 0, 0, 0, 0};
Distribution:
Edit
In Mathematica you can easily generate all 5-Tuples that add up 100 as:
IntegerPartitions[100, {5}]
There are 38225 different beasts, without counting permutations
Length@IntegerPartitions[100, {5}]
(* -> 38225 *)
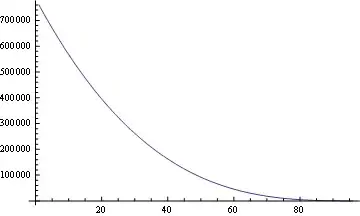
The frequency for each number in those quintuplets is:
Histogram@Flatten@IntegerPartitions[100, {5}]

The curve is very similar if one take permutations into account:
t = Tally@Flatten@(Permutations[#] & /@ IntegerPartitions[100, {5}]);
ListLinePlot@SortBy[t, #[[1]] &][[All, 2]]